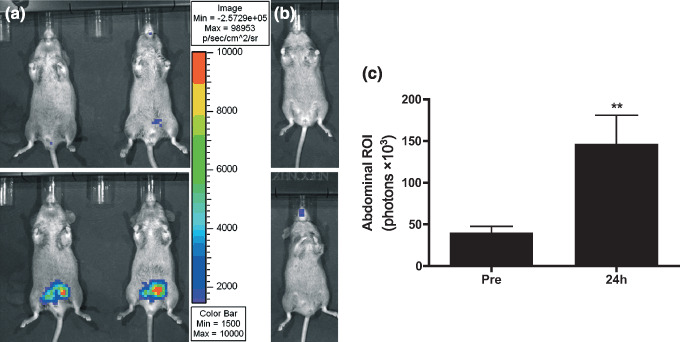
Figure 3.

Bioluminescence imaging of p53 induction in p53RE‐Luciferase mice. Mice were imaged before (top) and 24 h after administration of a single intraperitoneal injection of doxorubicin (1.5 mg/kg) (bottom). Gray‐scale image of the mice overlayed with a pseudo‐color image of bioluminescence. All window and level settings depict a range between 1500 and 10 000 photon/s and are consistent for all images. (a) male transgenic mice (n = 7); (b) female transgenic mouse (n = 3); (c) quantification of bioluminescence on abdominal regions of interest (ROI) in males before and after treatment with doxorubicin (P = 0.0096). Columns, averaged bioluminescence expressed as total photons flux in the ROI; bars, standard error of the mean.
