
Figure 1.
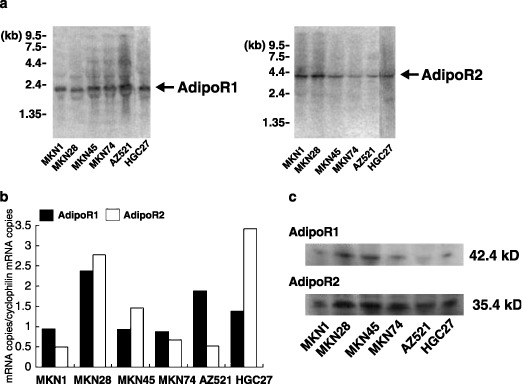
The expression of AdipoR1/R2 in human gastric cancer. (a) Northern blot analysis of AdipoR1 (left panel) and AdipoR2 (right panel) mRNA by different gastric cancer cells. Both receptors were detectable at 2.0 and 4.0 kb, respectively. (b) Reverse transcription‐polymerase chain reaction (RT‐PCR) was carried out on the total RNA as described in the material and methods section. The relative amounts of each AdipoR1/R2 transcript were normalized against the amount of cyclophilin transcript in the same cDNA.