
Figure 4.
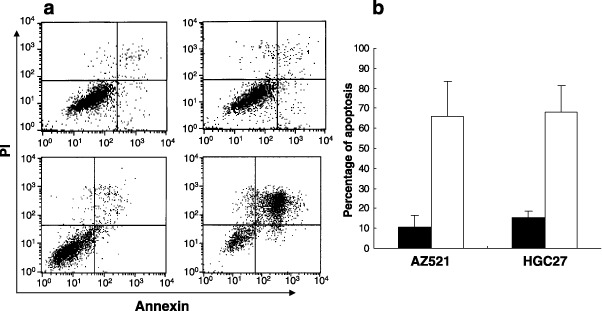
Apoptosis of AZ521 cancer cell with adiponectin. (a) AZ521 cell was cultured with (lower panel) or without (upper panel) 30 µg/mL adiponectin for 6 h (left panel) and 24 h (right panel), and then was double‐stained by Annexin‐V (x‐axis) and PI (y‐axis). The representative FACS profile was shown. (b) AZ521 and HGC 27 were cultured for 24 h with (white bar) or without (black bar) 30 µg/mL adiponectin for 24 h and Annexin‐V positive percentages were calculated as apoptotic cells. Columns indicate the mean of three different experiments performed in triplicate; bars indicate SD.