
Figure 1.
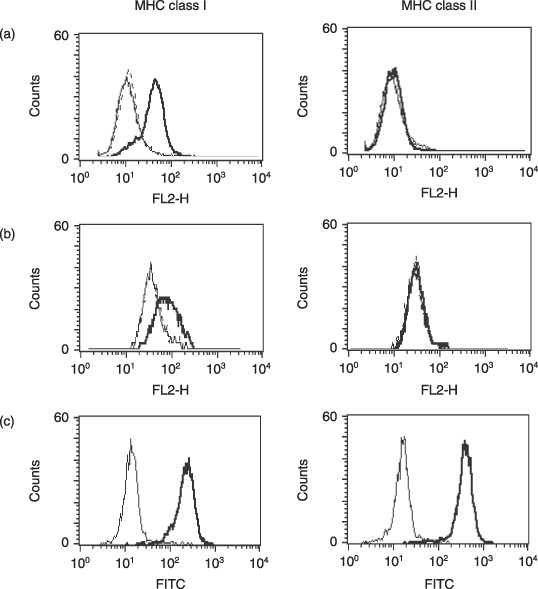
Expression of major histocompatibility complex (MHC) molecules on (a) Lewis lung carcinoma (LLC)‐ovalbumin, (b) LLC, and (c) MBL‐2 cells. (a,b) Simple, bold, and dotted lines indicate the expression levels of anticontrol IgG, and anti‐MHC molecule with or without pretreatment of 100 ng/mL interferon (IFN)‐γ for 72 h, respectively. (c) Simple and bold lines indicate the expression levels of anticontrol IgG and anti‐MHC molecule without pretreatment of IFN‐γ, respectively. FITC, fluorescein isothiocyanate.