
Figure 2.
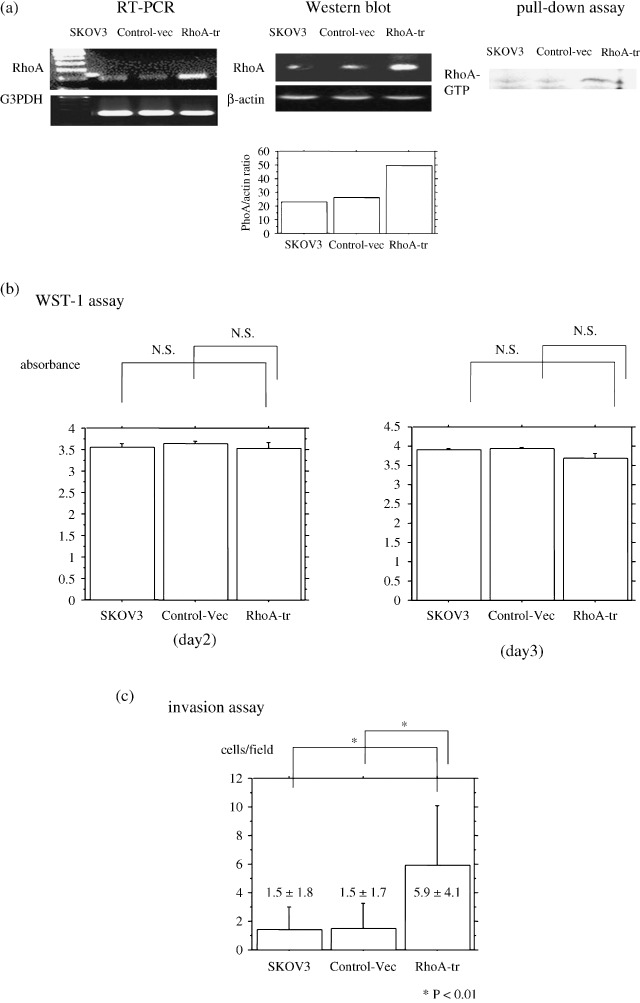
(a) Reverse transcriptase–polymerase chain reaction (RT‐PCR) for RhoA. An intense band for RhoA was observed in RhoA‐transfected ovarian cancer cells. The 226 bp band for G3PDH was obtained for all RT reactions. Analysis of RhoA protein by Western blotting. A stronger band of protein at 21 kDa for RhoA was revealed in RhoA‐transfected ovarian cancer cells compared with vector‐transfected cells and non‐transfected cells. A band (42 kDa) for β‐actin was observed in protein extracts from all cell lines. In addition, a Rho–GTP pull‐down assay revealed that RhoA‐transfected cells increased the amount of the GTP‐binding form of RhoA. (b) Effect of RhoA on the proliferation rate of cells cultured from RhoA‐transfected cells or from vector‐transfected cells. WST1 assay showed that the number of cultured cells per 96‐well plate was not changed by RhoA transfection at 3 day's incubation. Data are expressed as the means with 95% confidence intervals. P‐value is two‐sided and significant at P < 0.05. (c) Effect of RhoA on cell invasiveness. The Matrigel invasion assay showed that the number of invaded cells increased by RhoA transfection.