
Figure 3.
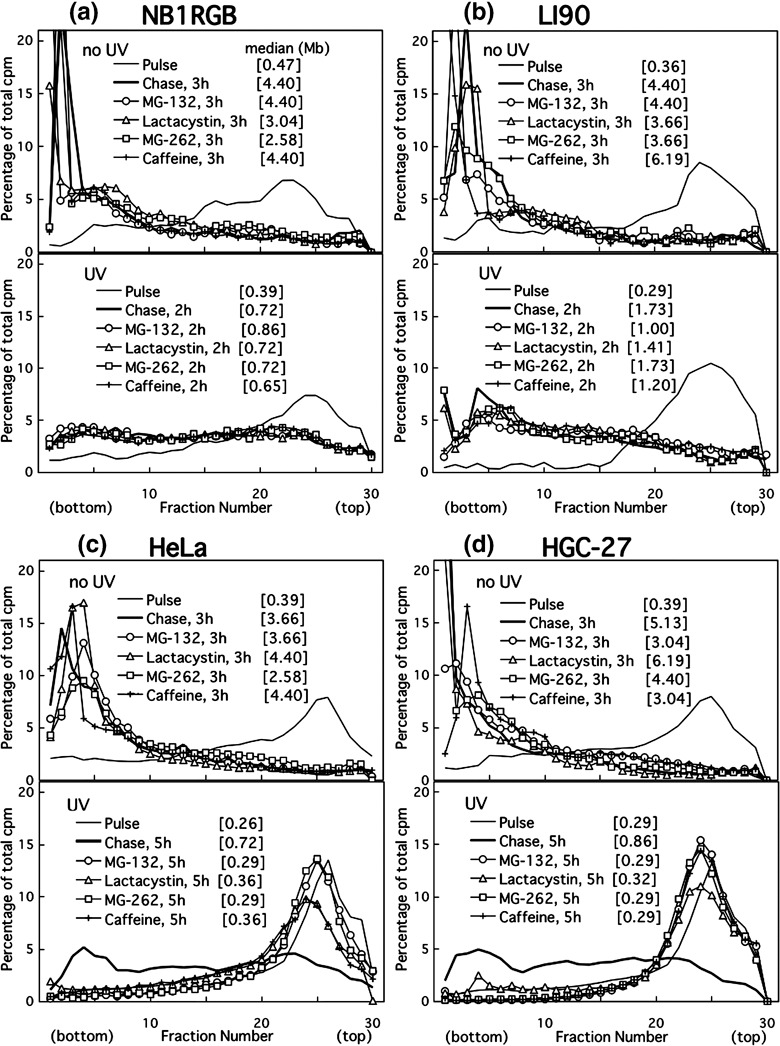
Alkaline sucrose density gradient centrifugation (ASDG) profiles of replication products in (a) NB1RGB (normal), (b) LI90 (normal), (c) HeLa, and (d) HGC‐27 (effects of proteasome inhibitors or caffeine.) Cells synchronized in the mid‐S phase were not irradiated, and were pulse‐labeled with 10 µCi/mL of [14C]thymidine for 30 min, washed twice with phosphate‐buffered saline (PBS), and incubated at 37°C in a normal medium containing 50 µM MG‐132, 200 µM lactacystin, 5.0 µM MG‐262, or 5 mM caffeine for 3 h (upper panel). Similarly synchronized cells were UV (10 J/m2)‐irradiated, incubated in a normal medium for 30 min, pulse‐labeled with the same concentration of [14C]thymidine for 1 h, washed twice with PBS, and incubated for 2 or 5 h at 37°C in normal medium containing 50 µM MG‐132, 200 µM lactacystin, 5.0 µM MG‐262, or 5 mM caffeine (lower panel). (a–d) Some of these profiles overlap. Sedimentation is from right to left. The average fragment length (in Mb) of each profile is shown in square brackets. cpm, counts per minute.