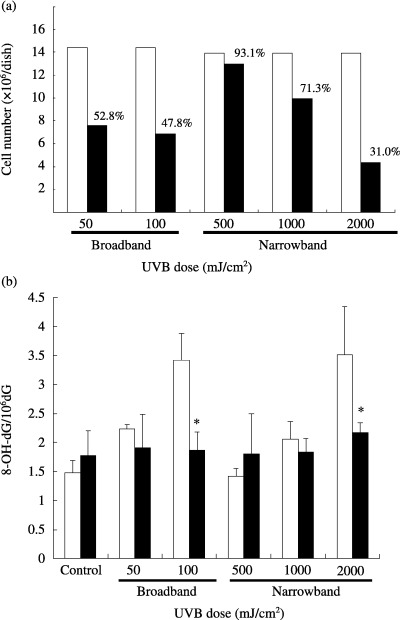
Figure 4.

(a) Viability levels of cells 24 h after ultraviolet (UV) B irradiation. □, Non‐irradiated cells; ▪, irradiated cells. (b) 8‐OH‐dG levels immediately (□) and 24 h after (▪) UVB irradiation. HaCaT cells were irradiated with the indicated doses of broadband or narrowband UVB. *P < 0.05, compared with the value immediately after UVB irradiation. The results represent the mean ± SD of four to five experiments.
