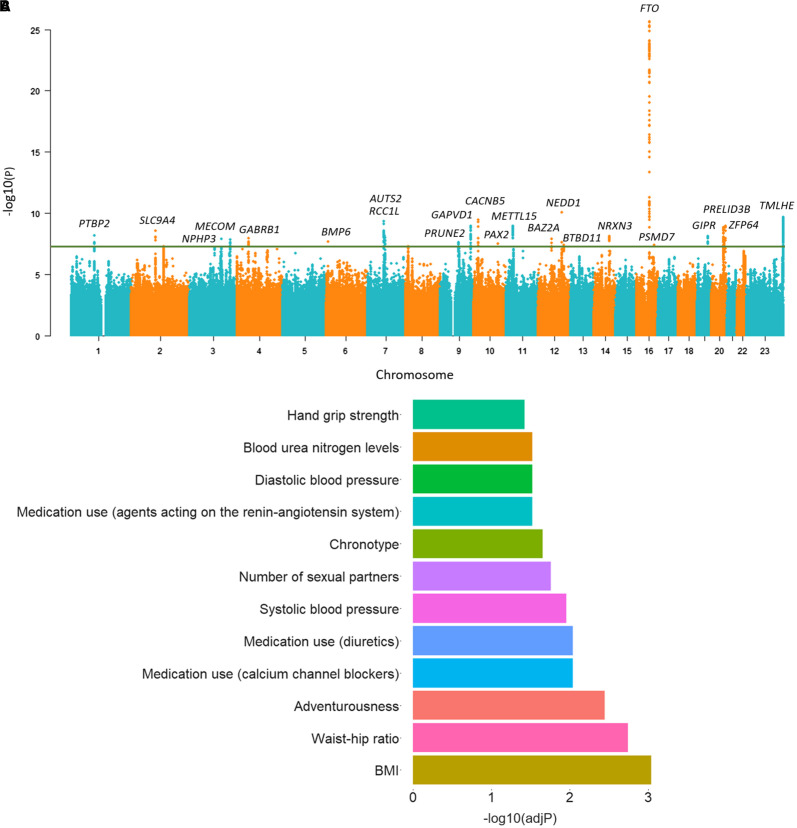
Figure 1.
(A) Manhattan plot for the genome-wide association study of obstructive sleep apnea (OSA) including 38,998 patients with OSA and 336,659 controls. For each genetic variant, the x-axis shows chromosomal position and the y-axis shows the −log10(P) value. The horizontal line indicates the genome-wide significance threshold of P = 5 × 10⁻⁸. (B) Enrichment analysis of the OSA-related genes into gene sets using the FUMA web application resulted in 28 significantly overrepresented pathways after false discovery rate correction, with one trait per category or disease shown here. BMI = body mass index.

