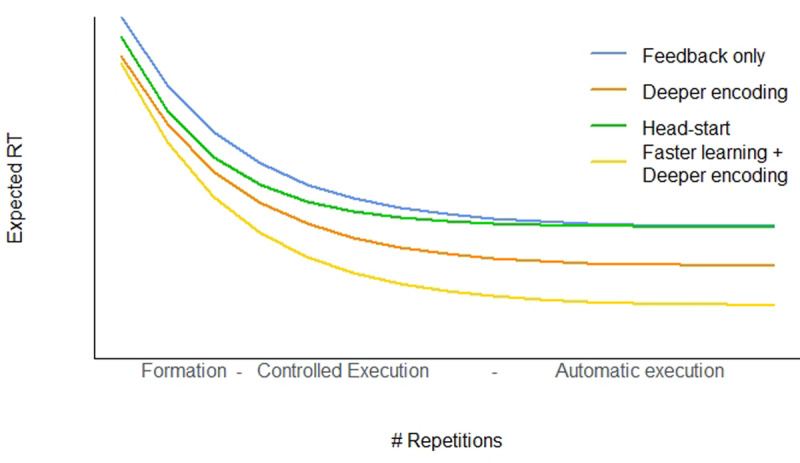
Figure 1.

Different ways in which instructions could speed up responses in a stimulus-response mapping task. The blue curve represents baseline behavior; The orange, green, and yellow curves represent the predictions of different theoretical proposals (see text for details).
