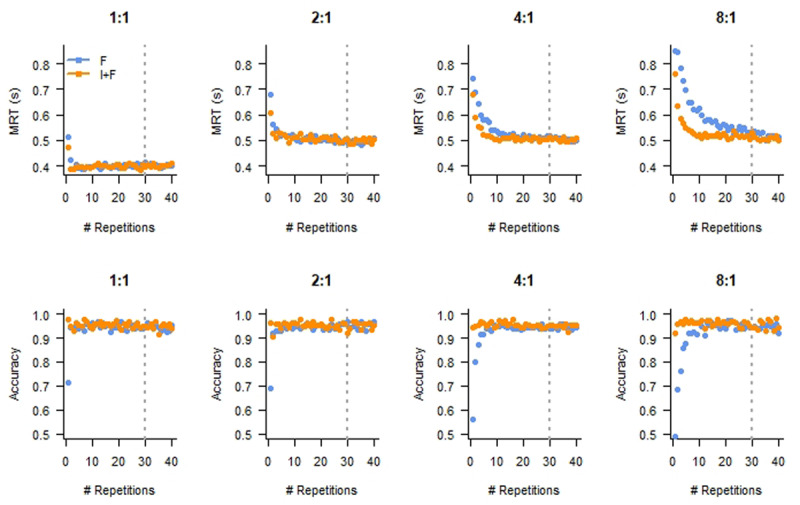
Figure 2.

Mean response time (MRT, top row) and Accuracy (bottom row) as a function of Repetition reveal the expected performance improvement. Panels depict different Mapping conditions. F: Feedback only; I+F: Instruction and Feedback. The dashed lines indicate the repetition number after which we considered the data as showing asymptotic behavior.
