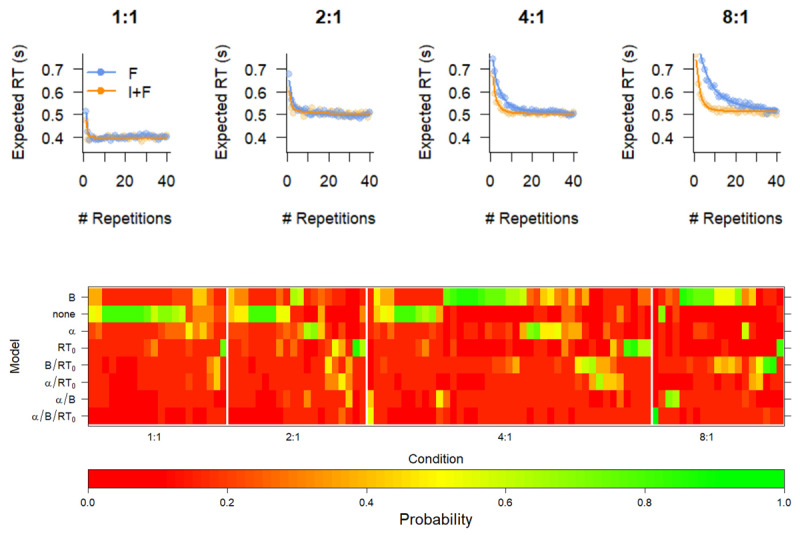
Figure 3.

Fit of optimal model (top) and Model comparison (bottom) of various constraints on the exponential curve reveal that instructions boost the initial level of performance. Top. Mean response times (RT, points) and Expected RT (solid lines) of the B model. I+F: Instruction and feedback; F: feedback only. Bottom. BIC weights of all models for all participants. The models are indicated by which parameter was free to vary between F and I+F conditions. Participants are grouped according to a hierarchical clustering algorithm within the Mapping condition, for illustrative purposes. The colors represent the BIC weight.
