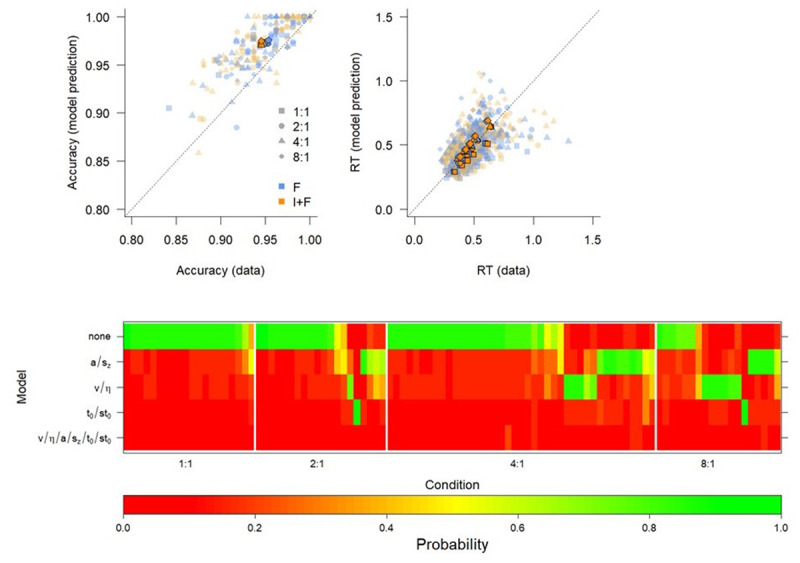
Figure 5.

Fit of optimal model (Top panel) and model comparison (Bottom panel) of various constraints on the Diffusion Decision Model reveal that there are no lasting effects of instruction. Top. QQ-plots of model fits of the none model. Individual data points refer to individuals, thick shapes indicate the mean of the 0.1, 0.3, 0.5, 0.7, and 0.9 quantile RTs (cf. Miletić & Van Maanen, 2019). I+F: Instruction and feedback; F: feedback only. Bottom. BIC weights of all models for all participants. The models are indicated by which parameter was free to vary between F and I+F conditions. Participants are grouped according to a hierarchical clustering algorithm within the Mapping condition, for illustrative purposes. The colors represent the BIC weight.
