
Figure 3.
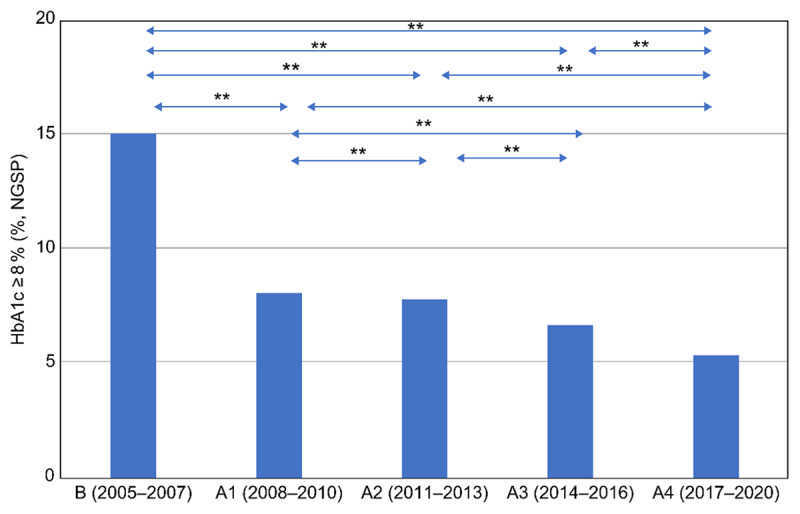
Comparison of HbA1c ≥ 8.0% before and after the start of Project 8 and the Uonuma School for Community Health and Social Care. The HbA1c ≥ 8.0% group was compared every three to four years, from 2005 to 2020. The classification of stages from 2005 to 2020 is the same as in Figure 2. A chi-square test, post hoc test, and Ryan’s multiple comparison were applied to compare all integrated criteria. * p < 0.05 and ** p < 0.01 were considered statistically significant. R version 3.6.2 (The R Foundation for Statistical Computing, Austria) was used for all statistical analyses.