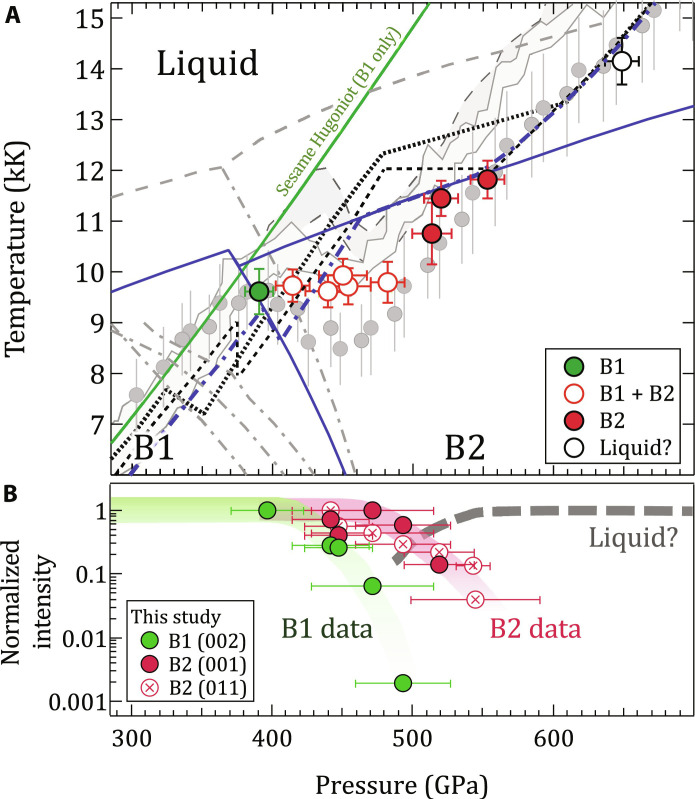
Fig. 1. Summary of single-crystal MgO results.
(A) Measured temperature and phase identifications of MgO as a function of pressure (see also fig. S1). The region of largest disagreement in previous shock experiments [gray bands, (19); gray circles, (8) with a pressure correction from (10); see fig. S11] is between 400 and 500 GPa, which corresponds in this study to that of the mixed B1 + B2 phase region. In contrast, theoretical calculations predict smaller temperature excursions along the shock Hugoniot [dotted (10), black dashed (15), and blue dash-dot (16)]. The corresponding phase boundaries are shown for melting [gray dashed, (17)] and the B1-B2 boundary [gray dash-dot, in increasing pressure (17, 18, 77, 78)]. B1 and B2 temperatures measured in this study are most consistent with the phase diagram of recent theory [blue solid lines, (16)]. The Hugoniot from the single phase (B1-only) Sesame equation-of-state table #7460 is shown as the solid green curve (64). (B) Integrated diffraction signal for B1 and B2 diffraction peaks as a function of sample pressure (see Materials and Methods). We note that the pressures associated with temperature (top, calculated over a skin depth at the shock front) differ slightly from those from XRD (bottom, calculated over the entire shocked volume). See table S1, and Materials and Methods for details.

