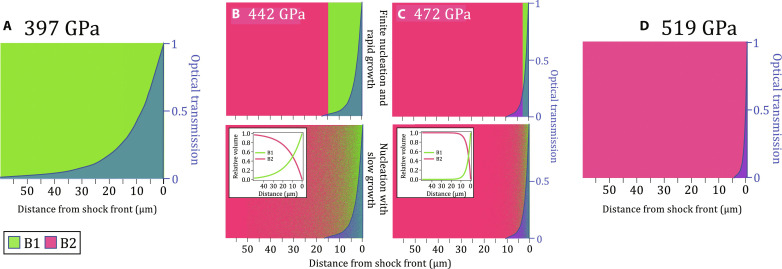
Fig. 5. Possible distributions of phase fractions within compressed MgO.
(A) Representation of a compressed volume of MgO at a shock pressure of 397 GPa (B1-only, green). On the basis of the measured optical depth at this pressure (∼12 μm, Fig. 4C), the optical transmission as a function of distance away from the shock front can be calculated (blue-shaded region). This represents the relative volume-dependent contribution to the SOP temperature measurement (as plotted in Fig. 1A). (B and C) represent pressures within the XRD measured mixed B1 + B2 phase region (Fig. 1A). For each pressure, the relative proportion of B1 (green) and B2 (maroon) phases are estimated by relative changes in normalized XRD intensity with pressure, as plotted in Fig. 1B. As our XRD data are volume-integrated, we cannot determine how the B1 and B2 phases are distributed within the compressed MgO, and knowledge of this distribution within the optical skin depth is needed to correctly interpret the measurements of temperature. Here, we consider two possibilities based on different transformation kinetics models: (top) finite nucleation and rapid (instantaneous) growth into the B2 phase, which results in a two-phase structure with distinctly separated B1 and B2 volumes and (bottom) nucleation with slow growth, resulting in a random mixed-phase assemblage within the measured optical skin depth. Our data are most consistent with the latter model and B2 nucleation time scales of <0.25 ns. The representation in (D) for a shock pressure of 519 GPa is B2-only (maroon) with a measured optical depth of <1 μm (Fig. 4C).

