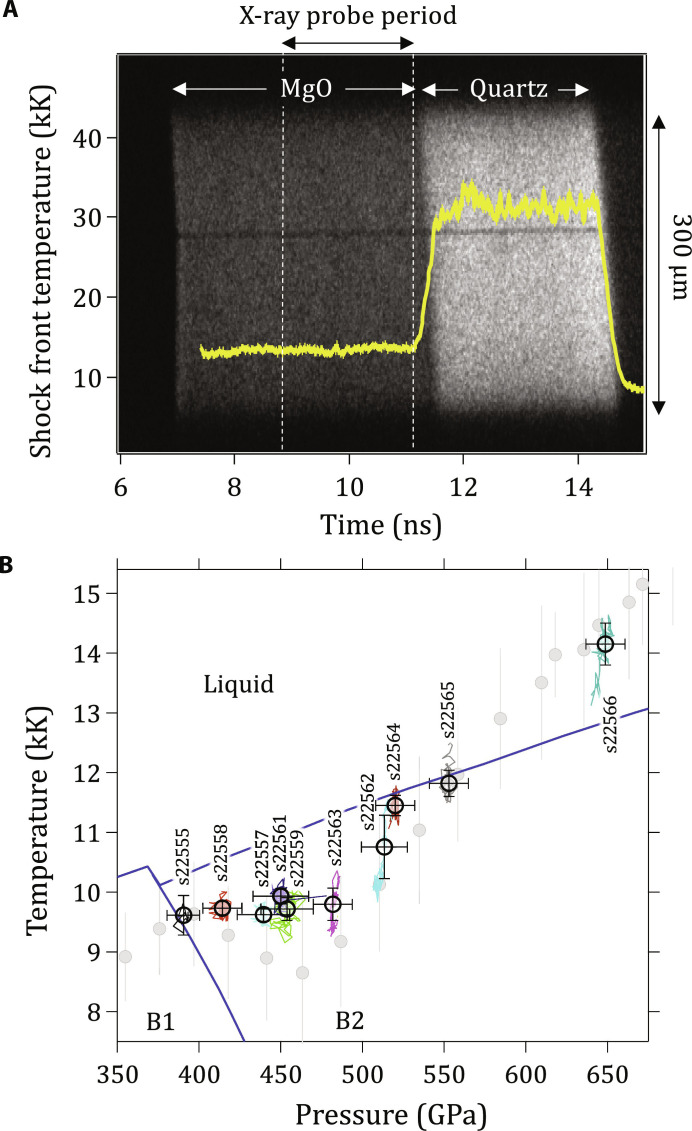
Fig. 7. Determination of MgO temperature from pyrometry measurements.
(A) Raw SOP data for shot s22264 [P = 520(12) GPa], where thermal emission from the MgO and quartz layers, over the 300-μm field of view, are indicated. Also plotted is the calculated shock-front temperature (yellow; see Materials and Methods). (B) Measured MgO shock-front temperature plotted as a function of calculated MgO shock-front pressure during the x-ray probe period. The shot number for each data point is shown. Recent quasi-anharmonic calculations by Soubiran et al. (2020) for the melt, and the B1-B2 phase boundary (blue curves) are also shown (16). The gray circles represent decaying shock measurements by McWilliams et al. (8), which have been corrected in pressure based on the subsequent Us-up measurements by Root et al. (see fig. S11) (10). Data points (as plotted in Fig. 1A) are shown as circles with uncertainties that represent the SD of the measured temperature and calculated pressure distribution (colored curves) during the probe period. An additional estimated ±300 K random temperature uncertainty associated with SOP measurements is combined with the distribution error bars shown here for the uncertainties shown in Fig. 1A (see Materials and Methods).

