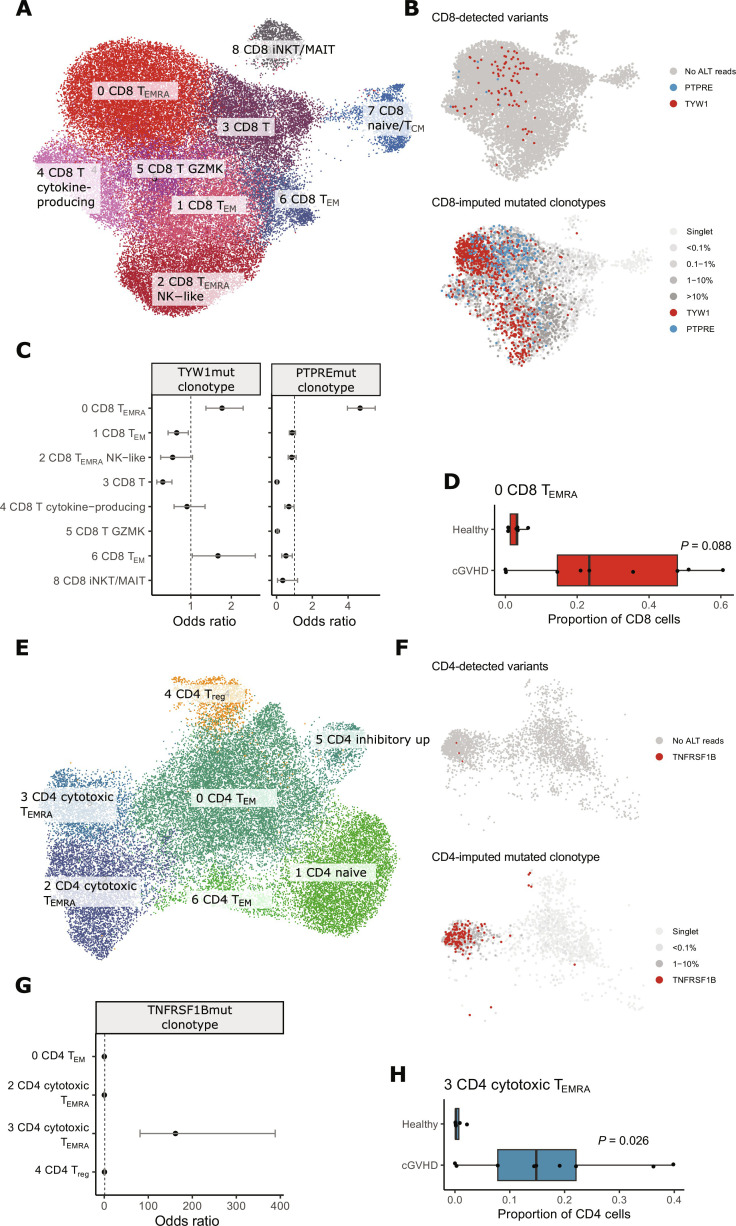
Fig. 4. Single-cell transcriptome analysis of nine patients with cGVHD and six age-matched healthy controls.
Analysis for CD8+ T cells is shown in (A) to (D) and for CD4+ T cells in (E) to (H). (A) Uniform Manifold Approximation and Projection (UMAP) and cluster annotation of CD8+ T cells. (B) We first identified cells with variants with genotyping of mutations found in immunogene panel sequencing with the Vartrix tool (top). CD8+ T cells with variant reads are marked with red (TYW1) or blue (PTPRE). Next, we imputed clonotypes of mutated cells based on TCRβ (shown on the bottom panel). (C) Phenotypes of mutated CD8+ clonotypes. Odds ratios and their associated 95% confidence intervals for mutated clonotypes against other CD8+ T cell clonotypes from the same patient. (D) Cluster 0 (CD8 TEMRA, i.e., terminally differentiated CD8+ T cells) was expanded in seven of nine patients with cGVHD but not in healthy controls. The x axis shows the proportion of cluster 0 phenotype in CD8+ T cells for each sample. P value has been calculated with the Mann-Whitney test. (E) UMAP and cluster annotation of CD4+ T cells. (F) CD4+ T cells with variant reads in TNFRSF19 (top) or imputed clonotype (bottom) are marked with red. (G) Phenotype of mutated CD4+ clonotype. Odds ratio and their associated 95% confidence intervals for mutated clonotype against other CD8+ T cell clonotypes from the same patient. (H) Cluster 3 (CD4 cytotoxic TEMRA) was expanded in seven of nine patients with cGVHD but not in healthy controls. The x axis shows the proportion of cluster 3 phenotype in CD4+ T cells for each sample. P value has been calculated with the Mann-Whitney test. TEM, effector memory T cell; Treg, regulatory T cell; TCM, central memory T cell; NK, natural killer, iNKT, invariant natural killer T cell; MAIT, mucosal-associated invariant T cell; GZMK, granzyme K.

