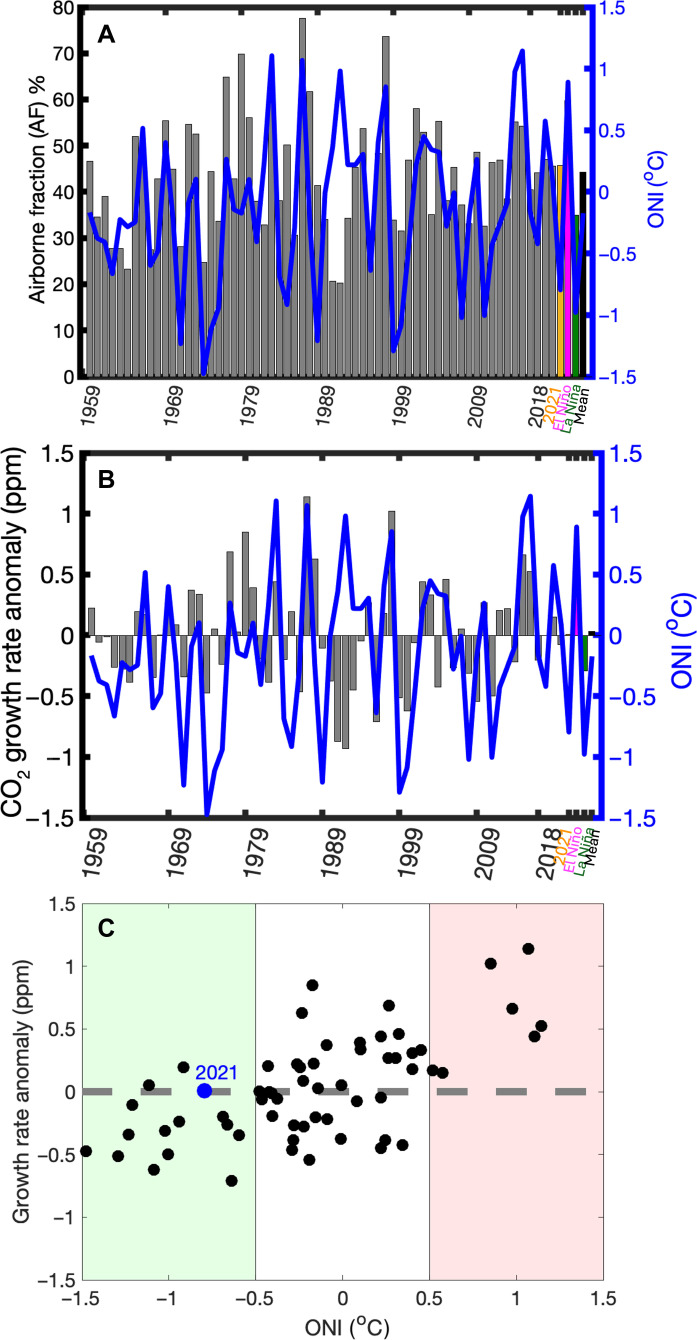
Fig. 1. The atmospheric CO2 growth rate and airborne fraction (AF) are generally lower during La Niña, while the growth rate in 2021 is close to average despite being in the middle of the longest La Niña in this century.
(A) AF (bars) and annual mean Oceanic Nino Index (ONI) (Oct-Sep) (unit: °C) between 1959 and 2021 (line). Gray bars, 1959–2020; orange, 2021; green, average AF during La Niña events; magenta, average AF during El Niño events; black, average over 1959–2021. (B) CO2 growth rate anomaly (black) (unit: ppm) and annual mean ONI (Oct-Sep) (unit: °C) between 1959 and 2021. (C) Annual ONI index versus CO2 growth rate anomaly between 1959 and 2021 without 1991 and 1992, when Pinatubo volcano eruption had a dominant impact (51). ONI is defined as sea surface temperature (SST) anomalies over Niño 3.4 region (5°N to 5°S, 170°W to 120°W). El Niño years are those with annual mean ONI greater than 0.5°C, and La Niña years are those with annual mean ONI lower than −0.5°C. Note that the annual mean ONI is the mean over Oct-Sep to account for possible lagged response of land climate anomalies to SST anomalies (37), while the annual CO2 growth rate for a given year is the CO2 difference between the end of December and the start of January of that year based on global marine surface data (https://gml.noaa.gov/ccgg/trends/gl_gr.html).

