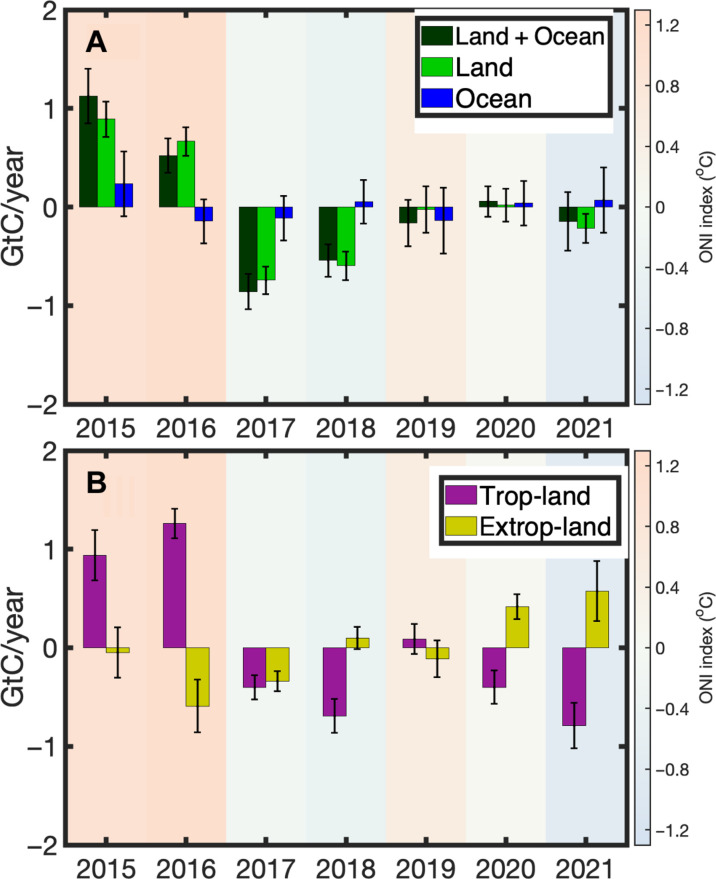
Fig. 2. The reduced net carbon uptake over the extra-tropical land offsets 72% of the increased net carbon uptake over the tropical land, causing the close-to-average atmospheric CO2 growth rate in 2021, despite being in the middle of the longest La Niña in this century.
(A) Annual combined land and ocean (dark green), land (light green), and ocean (blue) net carbon flux anomalies estimated by the ensemble top-down atmospheric inversion models (unit: GtC/year). (B) The annual NBE anomalies over tropical land (pink) and the extra-tropical land (yellow) (unit: GtC/year) from 2015 to 2021. Positive values indicate less carbon uptake from the atmosphere and vice versa. The sum of the NBE anomalies over the tropical land and the extra-tropical land in (B) is equal to the total land NBE anomaly plotted in (A). The background colors in these two panels are the annual ONI, with warm colors indicating positive SST anomalies while cool light blue indicating negative SST anomalies. Same as in Fig. 1, the annual ONI is defined as mean SST anomalies between October and September in Niño 3.4 region. The uncertainty bars in the figures represent the SDs among the ensemble top-down atmospheric inversion models.

