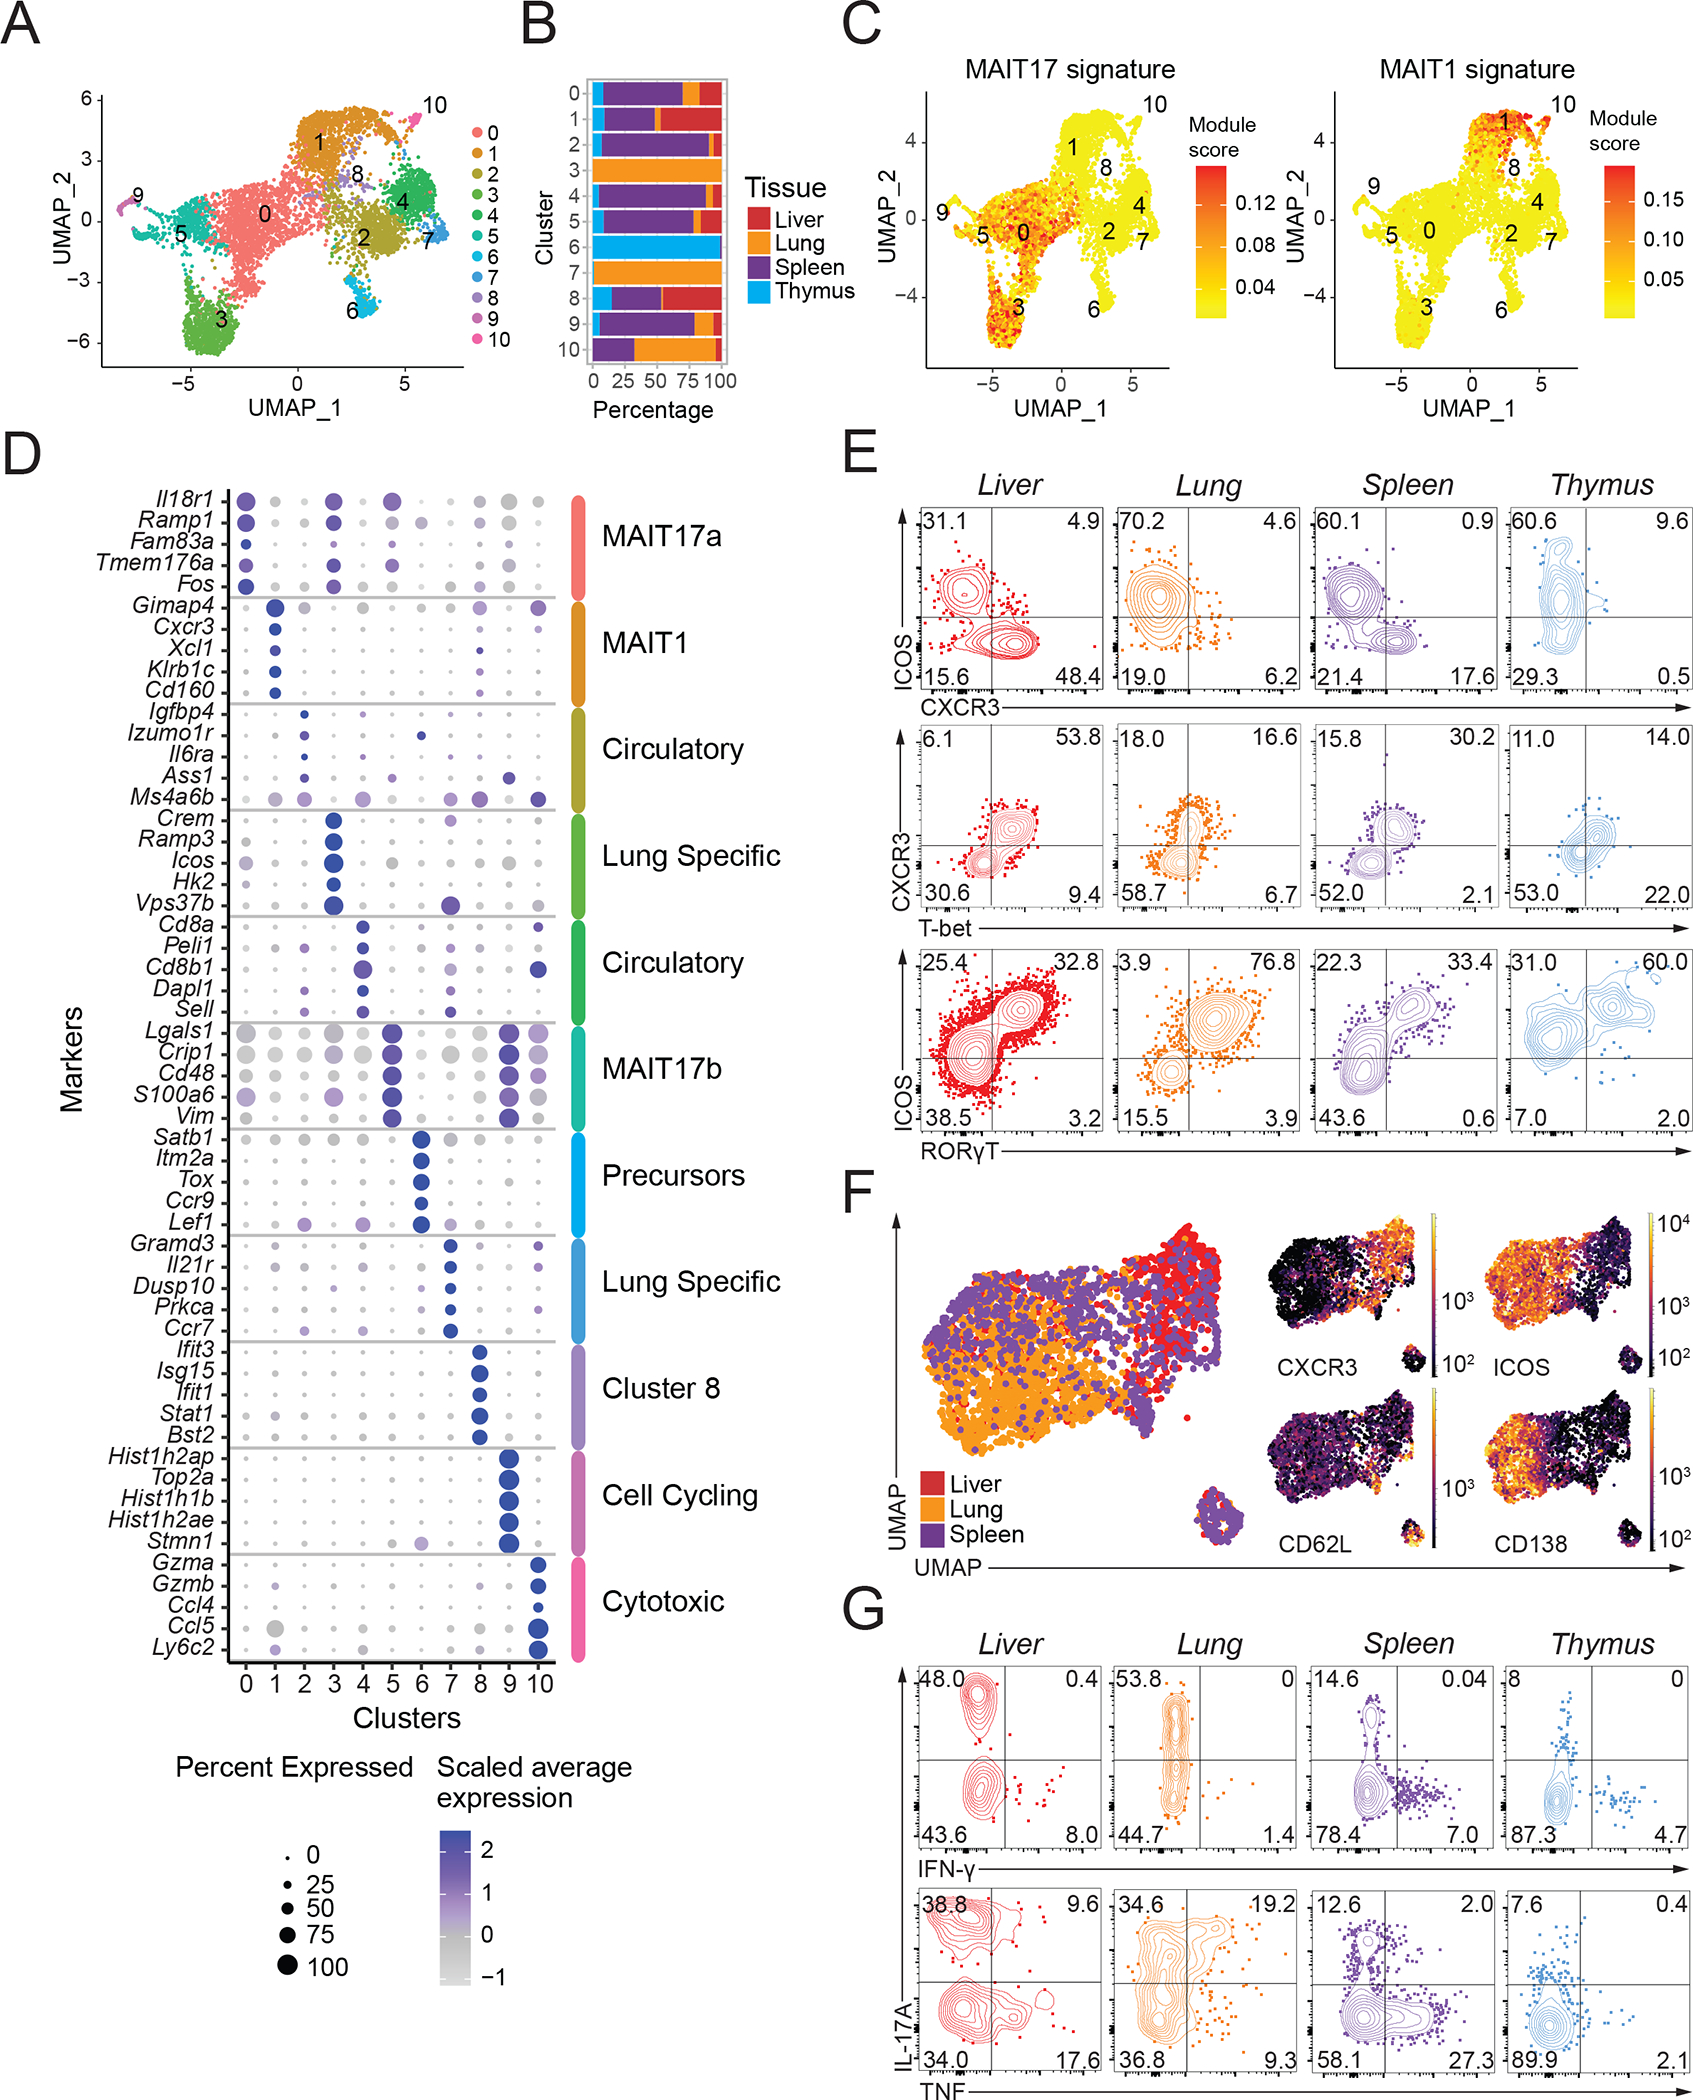
Figure 1: Mouse MAIT cell populations in different tissues.

(A) Transcriptomic analysis of 6,080 mouse MAIT cells at steady state was performed using the 10X Genomics platform. Uniform Manifold Approximation and Projection (UMAP) plots were generated by combining scRNA-seq libraries of MAIT cells from thymus, lung, liver and spleen. Clusters were identified by shared nearest neighbor modularity optimization-based clustering algorithm. (B) Bar graph shows for each cluster the tissue origin of the MAIT cells contributing to that cluster. (C) UMAP plot showing the MAIT17 and MAIT1 signature scores for each cell. Signature scores are the difference between the average expression levels of a gene set and control genes for each cell. (D) Dot plot showing top 5 positive marker genes in each cluster. Color gradient and dot size indicate gene expression intensity and the relative proportion of cells within the cluster expressing each gene, respectively. (E) Representative flow cytometry plots showing expression of the indicated surface proteins and transcription factors by MAIT cells from the indicated tissues. (F) Flow cytometry data were acquired using a panel of 17 fluorescent parameters. MAIT cell data from liver, lung and spleen were used to perform UMAP dimensional reduction and unsupervised clustering using the FlowSOM algorithm on the OMIQ software. A total of 3,791 MAIT cells were included in this analysis. (G) Cytokine expression by MAIT cells upon PMA/Ionomycin stimulation in vitro. Intracellular cytokine staining data were representative of 3–4 mice per group, representative of 3 experiments.
