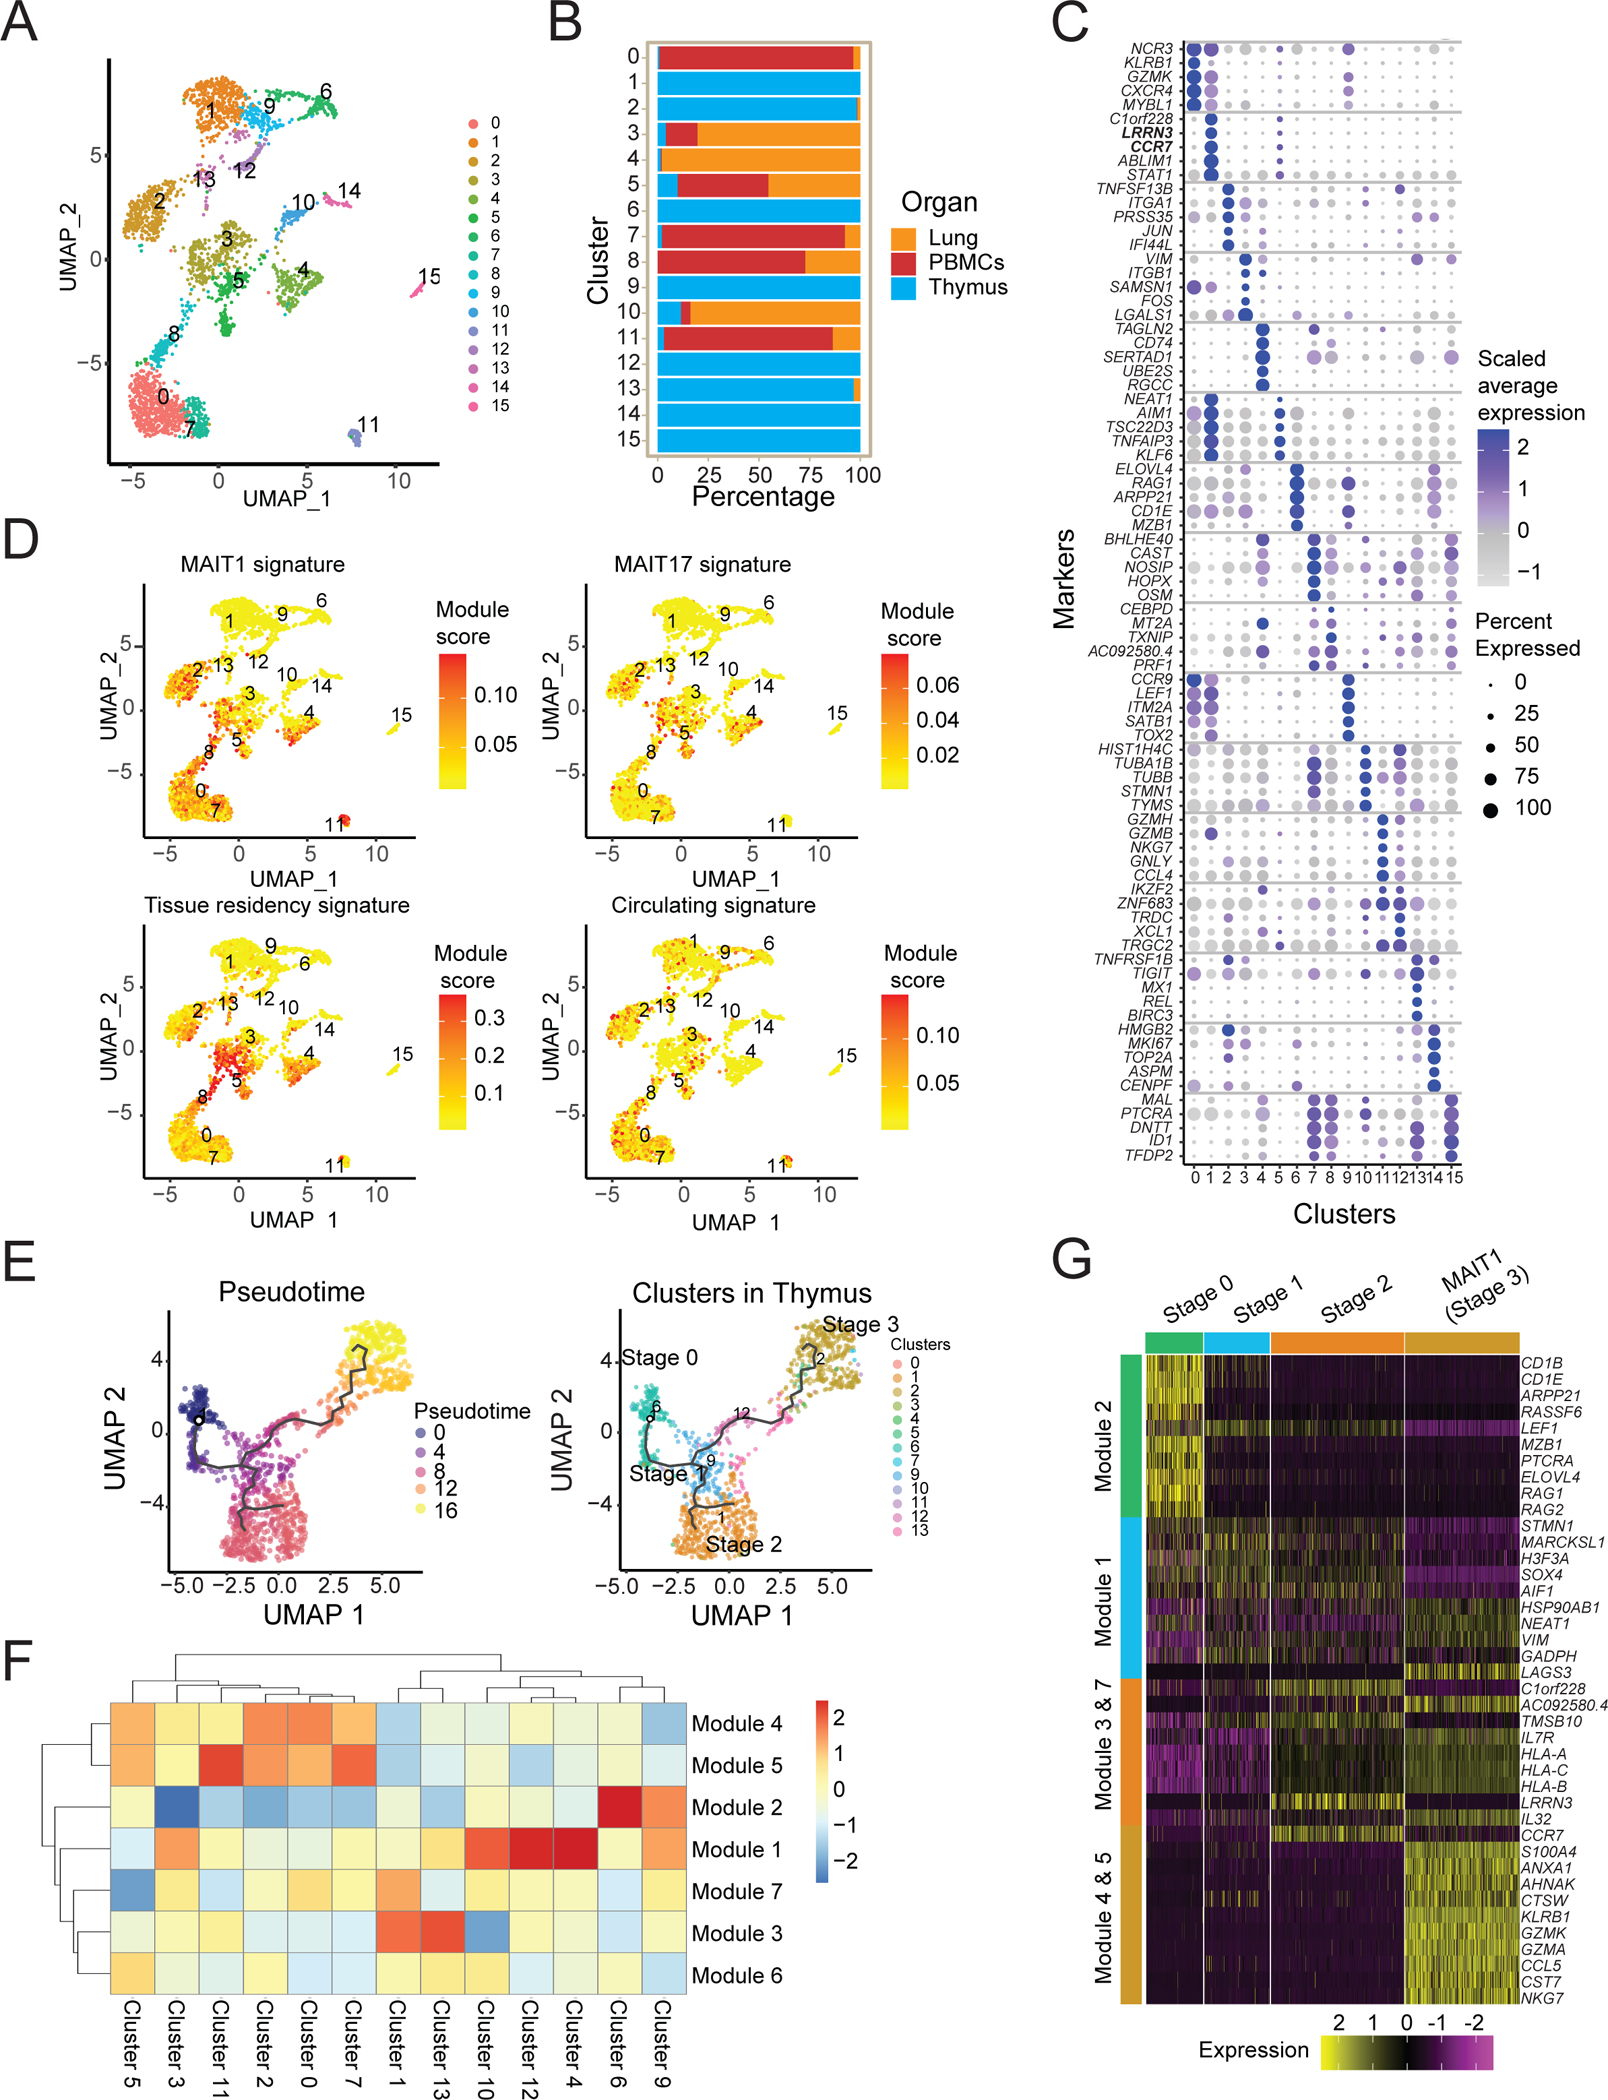
Figure 5: Human MAIT cell populations in different organs.

(A) UMAP plots of transcriptomic analysis of human MAIT cells generated by combining three individual scRNA-seq libraries from human thymus (n=5), lung (n=4) and PBMCs matched from the lung donors (n=4) (Supplementary Table S7). (B) Bar graph shows the contribution of MAIT cells from different tissues to individual clusters. (C) Dot plot showing top 5 positive marker genes for each cluster. (D) UMAP showing the MAIT1, MAIT17, tissue residency and circulating signature scores for each cell. (E) UMAP (left) of human MAIT cells from thymus with cells ordered in pseudotime and UMAP showing distribution of thymic MAIT cells (right) across branches of single-cell trajectories. Cells are colored and numbered by clusters as in Fig. 5A. (F) Heatmap showing different stages of development and respective cell clusters on the x-axis and co-regulated gene modules on the y-axis. Modules were generated with genes that are differentially expressed along the trajectory path. The legend shows color-coded aggregate module scores for gene modules for cells in each cluster; positive scores indicated higher gene expression. (G) Scaled average expression heatmap of top 10 genes from modules that were expressed in indicated stages of MAIT cell development based on high Morans I value as shown in Fig 5F. These genes were selected based on their expression changes as the cells progressed along the MAIT cell developmental trajectory.
