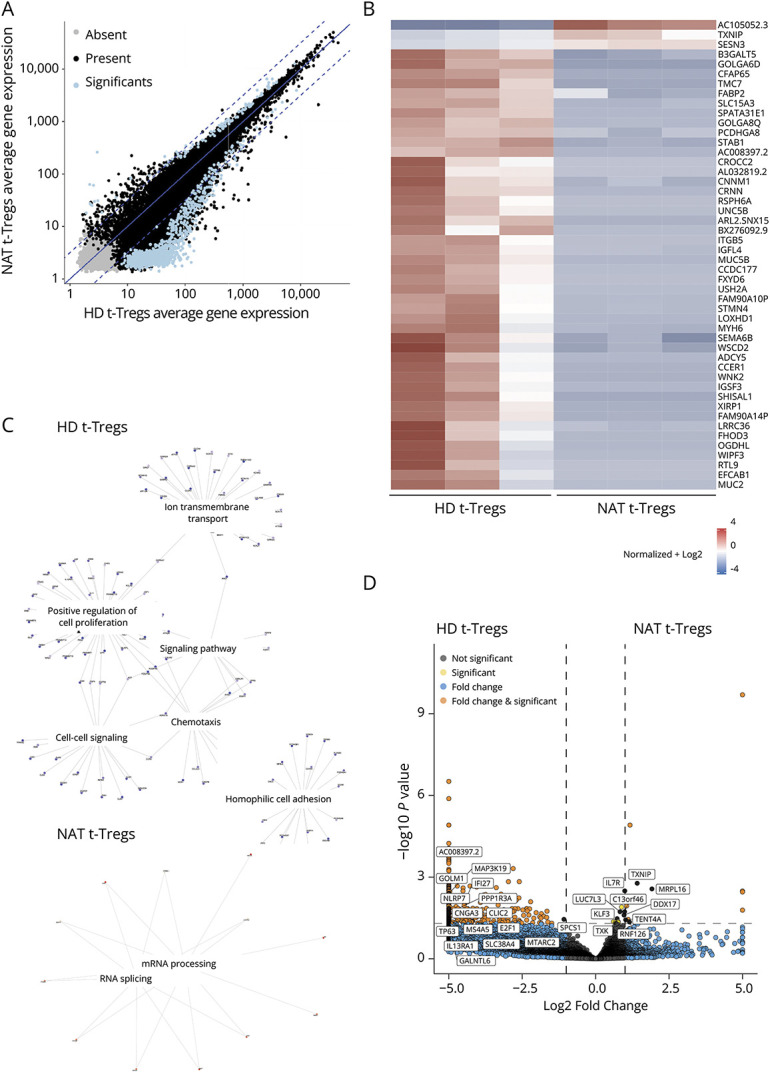
Figure 5. Transcriptomic Analysis of t-Tregs Derived From Natalizumab-Treated Patients and Healthy Donors.

(A) Comparison of average gene expression showing significantly differentially expressed genes between t-Tregs derived from natalizumab-treated patients and HDs. Present (black) indicates genes with read counts ≥10 in more than one sample, absent (gray) indicates all genes that are not flagged as present, and significant (blue) indicates genes with log2 ratio >0.5 and a p value <0.01. Log2 ratio indicates the fold-change in gene expression. (B) Heatmap showing the expression counts of the top 50 differentially expressed genes across t-Tregs derived from natalizumab-treated patients and HDs. Both positive and negative log fold changes are displayed. (C) Genes belonging to different Gene Ontology (GO) Biological Process (BP) terms were upregulated in t-Tregs derived from natalizumab-treated patients and HDs, respectively. (D) Volcano plot showing genes involved in T-cell activation, proliferation, metabolism, and RNA processing differentially expressed between t-Tregs derived from natalizumab-treated patients and HDs (log2 fold change threshold >1.5; false discovery rate <0.05).
