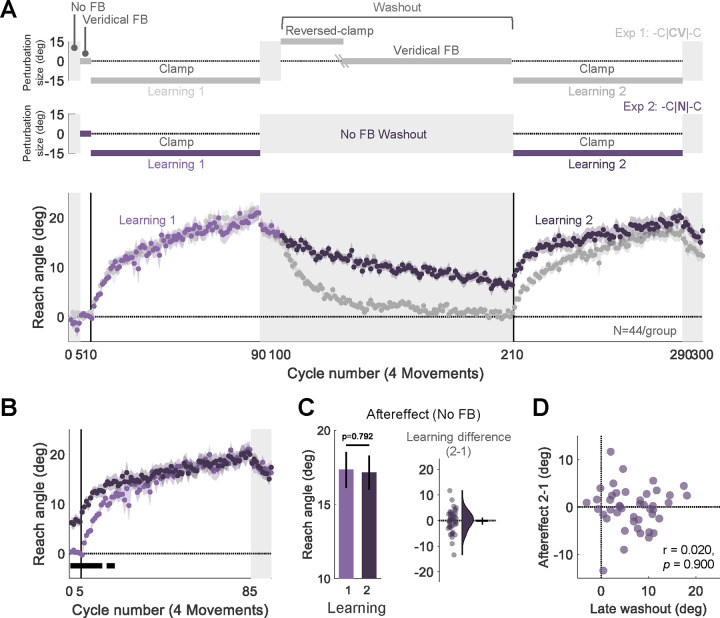
Fig 2. Experiment 2: Implicit adaptation is not attenuated upon relearning when feedback is eliminated during the washout block.
(A) Experimental protocol and learning functions. Top: Participants (N=44) experienced 110 cycles of trials without feedback (N) during a washout block that separated the two learning blocks (-C|N|-C design, purple). Bottom: Time course of mean reach angle averaged over cycles. Light and dark shading signify learning blocks 1 and 2, respectively, with the onset of the clamped feedback marked by the vertical solid lines. The design and learning functions from Experiment 1 are reproduced here to provide a visual point of comparison (gray). (B) Overlaid reach angle functions for the two learning blocks and two aftereffect blocks in Experiment 2 (significant clusters based on p<0.05) (C) The left panel presents the aftereffect (mean ± SEM) for each learning block and the right panel the within-participant difference (Aftereffect 2 – Aftereffect 1; dots and violin plot- distribution of individual difference scores, bar- mean and 95% CI). (D) Scatter plot showing no relationship between the reach angle at late washout and change in relearning (Aftereffect 2 – Aftereffect 1). SEM, standard error of the mean. CI, Confidence Interval.

