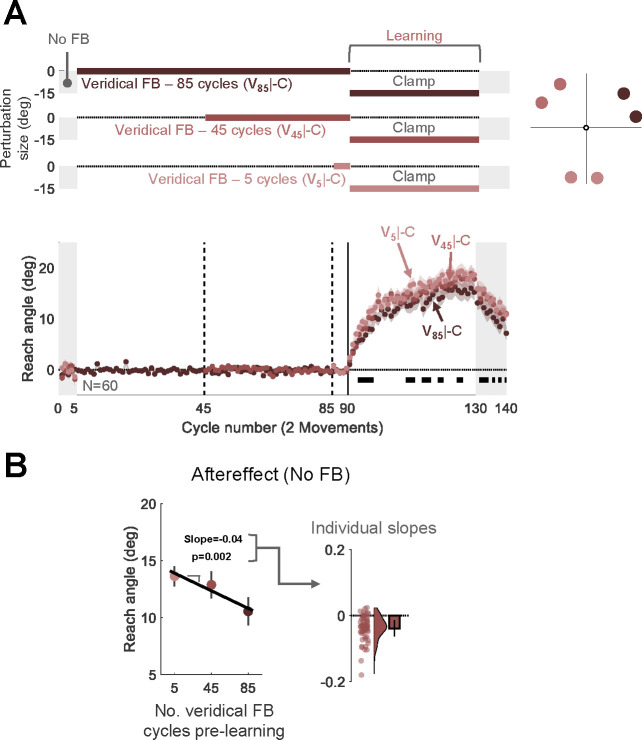
Fig 5. Experiment 5: Interference from veridical feedback is context-specific.
(A) Experimental protocol and learning functions. Top: During the learning block, participants (N=60) experienced rotated clamped feedback while reaching to six targets, with two targets falling within each of three wedges distributed across the workspace. For each wedge, participants experienced a different number of cycles with veridical feedback prior to the learning block: 5 (V5|-C, light red); 45 (V45|-C, medium red); 85 (V85|-C, dark red). Bottom: Time course of mean reach angle averaged over cycles (2 movements) for each wedge. The vertical solid lines at cycles 45 and 85 mark the onset of movements to an additional location, and the vertical solid lines at cycles 90 mark the onset of the task-irrelevant clamped feedback. Horizontal thick black lines denote clusters of cycles that show a significant relationship between the reach angle and the number of veridical cycles (p < 0.05). (B) Left panel presents the aftereffect results (mean ± SEM) for each learning condition with the fixed effect regression line obtained using a linear mixed model. Right panel shows the distribution (dots and violin plots) of individuals’ slopes (random effect); bar- mean slope and 95% CI. SEM, standard error of the mean. CI, Confidence Interval.

