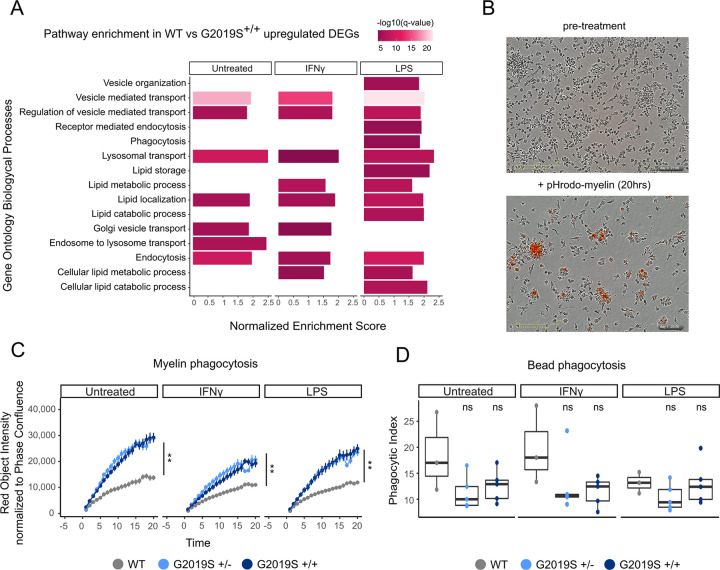
Figure 3. G2019S+/+ iMGLs show alterations in lipid metabolism and phago-lysosomal pathways.
(A) Pathway enrichment analysis for the upregulated DEGs using Biological Process from GSEA. Pathways are represented in the y axis and normalized score in the x axis. Significance (−log10 P value scale of the q-value) is represented by color. Only significant pathways (q-value < 0.05) of pathways related to lipid metabolism and phagocytosis are represented. (B) Representative bright focus microphotographs of iMGLs subjected to ph-rodo labeled human myelin. Top picture shows iMGLs before treatment and bottom picture shows iMGLs after 20 hrs treatment with pH-rodo labeled human myelin. (C) Myelin phagocytosis of iMGLs under the different treatments measured by IncuCyte microscope. The y axis shows the phagocytic capacity measured as red object intensity normalized by cell confluence and the x axis the different time points. Genotypes begin to diverge in their myelin phagocytosis after 3 hours (n = 3 independent differentiations, Linear mixed effects model ** P value < 0.001) and show significant differences across genotypes by the end of 20 hours (n = 3 independent differentiations, ANOVA with Dunnett’s post-hoc test ** P value < 0.001). (D) Carboxylated-beads phagocytosis of iMGLs under the different treatments measured by FACS. Y axis represents the phagocytic index and x axis the different treatments (n = 3 independent differentiations, ANOVA with Dunnett’s post-hoc test).

