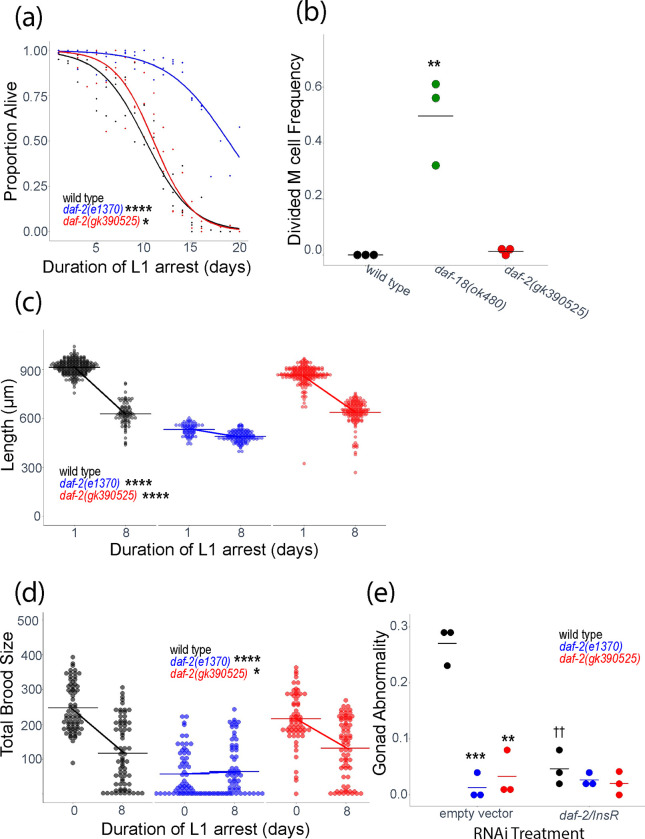
Figure 2.
daf-2(gk390525) mutants display IIS loss-of-function larval phenotypes related to L1 starvation resistance. A) L1 starvation survival was scored daily for three biological replicates. Individual points represent an observation for a population of ~100 animals (median = 97, range = 36–152) in a single biological replicate, and curves were fit with logistic regression. Two-tailed, unpaired variance t-tests were used to compare half-lives between wild type and each mutant. See Table S2 for complete data. B) M cell divisions were scored after 3 days of L1 arrest in the daf-18(ok480) mutant background, and after 8 days for all other genotypes using an hlh-8 reporter gene as an M cell marker in three biological replicates. Horizontal lines represent the mean proportion of animals with at least one M cell division across replicates, and points represent the proportion per replicate (scoring ~100 animals). A one-sided t-test was used to assess significance. See Table S2 for complete survival data. C) Worms were imaged and body length was measured after 48 hours of recovery from 1 (control – arrested L1s plated 24 hr after hypochlorite treatment) or 8 d L1 arrest in three biological replicates. Individual points represent an observation for a single animal. D) Total brood size was scored for ~18 individual worms in each of three biological replicates (median = 18, range = 11–18). Worms recovered from 8 d L1 arrest are compared to unstarved controls (0 days L1 arrest – embryos plated directly with food). Individual points represent individual animals. E) The frequency of adults with gonad abnormalities was scored in previously starved animals (8 days L1 arrest) in three biological replicates. Individual points represent an observation in a population of ~50 individuals in a single biological replicate. Horizontal lines represent the mean abnormality frequency across replicates within the same condition. Homogeneity of variance across conditions and replicates was tested using Bartlett’s test, and if variances were found to not be unequal they were pooled for statistical analysis. Two-tailed, unpaired t-tests with variance pooled were used to compare the frequency of gonad abnormalities between each mutant and wild type (indicated with asterisks) and between each RNAi treatment and empty vector control (indicated with crosses). C, D) A two-factor, linear, mixed-effects model was fit to the data with body length (C) or total brood size (D) as the response variable, interaction between starvation and genotype as the fixed effects, and replicate as the random effect. P-values for interaction terms are reported, assessing starvation-dependent effects of each genotype on phenotype. Horizontal lines represent the mean length per condition across replicates, and diagonal lines connecting the means between conditions within the same genotype represent the effect of starvation. A-E) * P < 0.05, ** P < 0.01, *** P < 0.001, **** P < 0.0001, †† P < 0.01.

