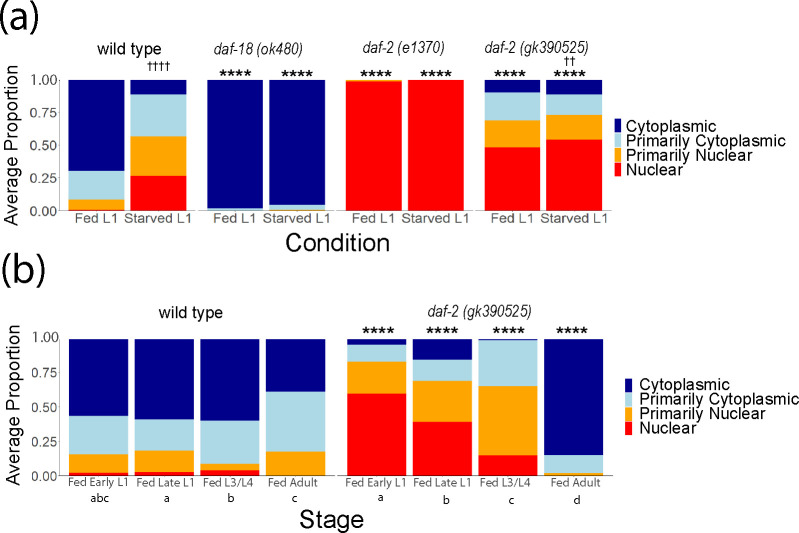
Figure 3.
DAF-16 localization in daf-2(gk390525) reveals a developmental transition from loss-of-function behavior in larvae to gain-of-function behavior in adults. A) DAF-16::GFP sub-cellular localization was scored in fed (18 hr after hypochlorite treatment, or about 6 hr L1 development) and starved (24 hr after hypochlorite treatment, or about 12 hr L1 arrest) L1 larvae. Significant differences within genotype between conditions are indicated with crosses. B) DAF-16::GFP sub-cellular localization was scored throughout postembryonic development (18, 24, 48, and 72 hr after hypochlorite treatment, or about 6, 12, 36, and 60 hr postembryonic development, respectively). Statistically significant differences between stages within the same genotype are indicated with letters (a, b, and c), with members of groups sharing letters not being significantly different from each other (p = 0.05). A, B) Localization was scored as nuclear, primarily nuclear, primarily cytoplasmic, or cytoplasmic in intestinal cells in three biological replicates. Average frequency across replicates for each category is displayed. Cochran-Mantel-Haenszel chi-squared tests were used to compare the distribution of cellular localization between genotypes and conditions. Comparisons between each mutant and wild type within the same conditions are indicated with asterisks. ** P < 0.01, **** P < 0.0001. †† P < 0.01, †††† P < 0.0001

