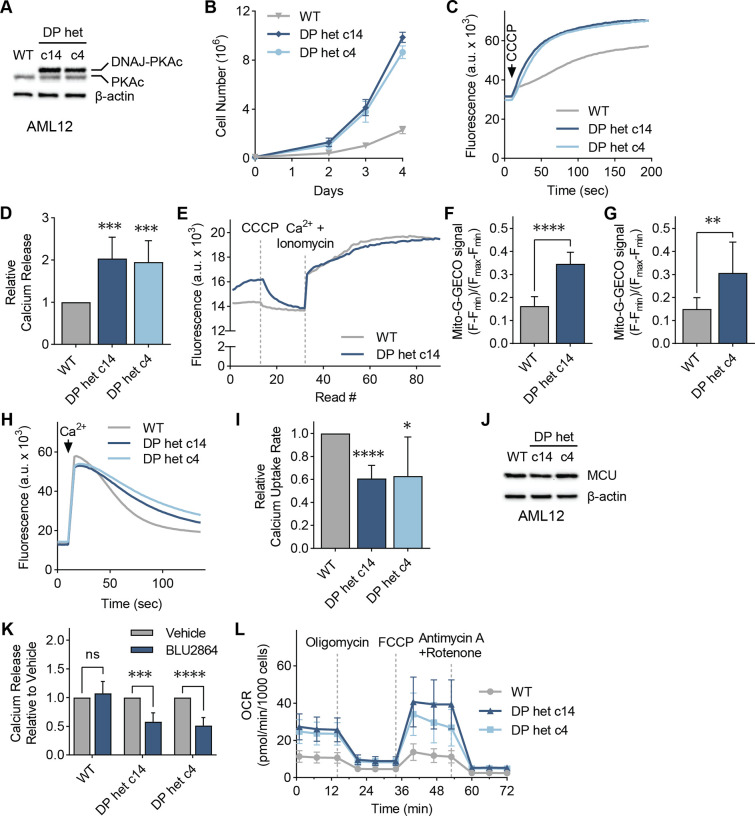
Figure 4: Cellular models of FLC show DP-dependent increase in mitochondrial Ca2+ levels.
(A) Immunoblot of lysates from AML12 WT and clones c14 and c4 using an antibody against PKAc confirm heterozygous DP expression in the clones. (B) Proliferation of cellular models of FLC compared to WT AML12 cells; cells were counted on days 2, 3, and 4 after plating; n=3. (C, D) Representative traces (C) and quantification (D) of mitochondrial Ca2+ release assays in AML12 cells; cells were treated with uncoupler CCCP, and the relative amount of Ca2+ released was quantified using a Ca2+ indicator dye; statistical significance was determined by one-sample t-test; n=10. (E) Representative trace of mitochondrial free Ca2+ levels of AML12 WT and c14 cells quantified using matrix-targeted Ca2+ reporter G-GECO (mito-G-GECO). (F, G) Baseline mito-G-GECO fluorescence normalized to minimum and maximum signals in AML12 WT and c14 (F) or c4 (G) cells; statistical significance determined by Mann Whitney test; n=20–23 (F) and n=12 (G). (H, I) Representative traces (H) and mitochondrial Ca2+ uptake rates in AML12 cells (I); mitochondrial Ca2+ uptake rates were calculated by monitoring Ca2+ clearance in the presence of a Ca2+ indicator dye; statistical significance determined by one-sample t-test; n=9. (J) Immunoblot of MCU shows comparable MCU expression in FLC clones compared to WT controls. (K) Mitochondrial Ca2+ release after cells were treated with 5 μM PKA inhibitor BLU2864 or DMSO for 4 days was measured as in (C); fold change in released Ca2+ is shown relative to DMSO control for each cell line; statistical significance determined by paired t-test, n=7–9. (L) Seahorse extracellular flux analysis in FLC clones compared to WT AML12 cells at baseline and after indicated treatments; n=10–16. All error bars indicate standard deviation; * indicates a p-value < 0.05, ** indicates a p-value < 0.01, *** indicates a p-value < 0.001, **** indicates a p-value < 0.0001

