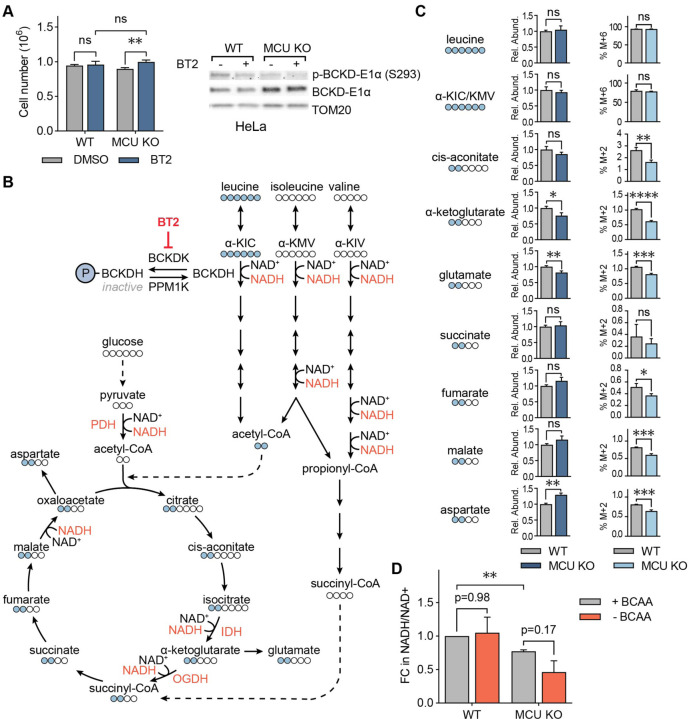
Figure 3: BCAA catabolism maintains NADH/NAD+ balance in MCU KO cells.
(A) Cell numbers of WT and MCU KO cells with and without pharmacological activation of BCAA catabolism by BT2. Cells were counted three days after plating and treatment; n=4–5. Immunoblots show phosphorylated and total BCKD-E1α after vehicle DMSO or BT2 treatment. Statistical significance was determined by Dunnett’s multiple comparisons test following one-way ANOVA. (B) Schematic of BCAA catabolism and TCA cycle enzymes and metabolites; BCAA catabolism produces acetyl-CoA and succinyl-CoA, which can enter the TCA cycle; Ca2+-regulated enzymes and NAD+/NADH coupled reactions are shown in red. Labelled leucine carbons (indicated as blue circles) and their incorporation into the TCA cycle are also shown. (C) Relative abundance of indicated metabolites and their fraction generated from labeled leucine in WT and MCU KO HeLa cells. (D) Relative NADH/NAD+ ratios in WT and MCU KO cells with and without 3hr BCAA starvation are shown. Statistical significance was determined by the Tukey-Kramer test following one-way ANOVA; n=3. All error bars indicate standard deviation; ns indicates non-significant, * indicates a p-value < 0.05. ** indicates a p-value < 0.01, *** indicates a p-value < 0.001, **** indicates a p-value < 0.0001.

