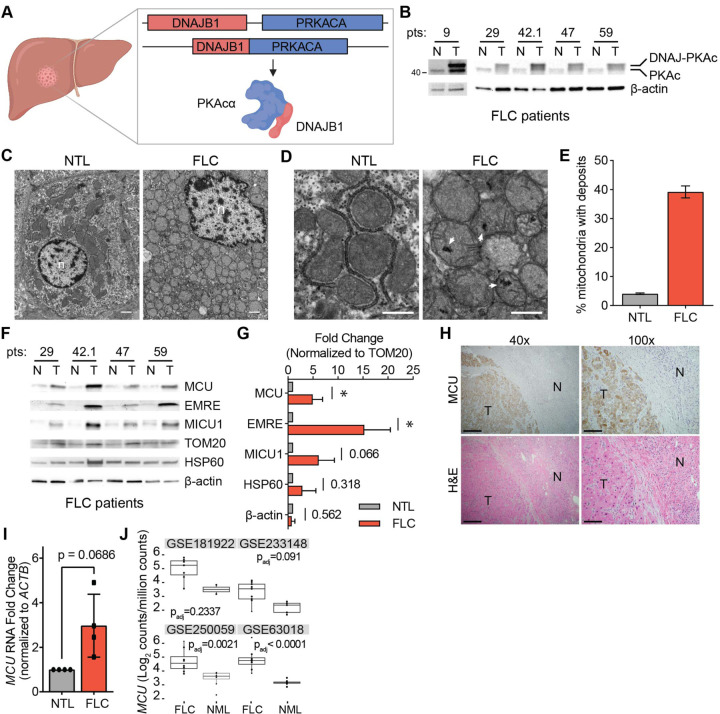
Figure 4. FLC is characterized by increased mitochondrial Ca2+ levels and uniporter expression.
(A) Schematic of FLC liver tumor with heterozygous deletion in chromosome 19 producing the DNAJ-PKAc (DP) fusion protein. (B) Immunoblots of lysates from non-tumor (N) and tumor (T) liver from FLC patients show DP fusion protein expression in the tumor. (C) Electron micrographs at 10,000x magnification of non-tumor (NTL) and tumor (FLC) sections from patient 9; nuclei are labeled n; scale bars = 1 μm. (D) Micrographs of samples shown in (C) at 25,000x magnification; white arrowheads mark representative Ca2+ deposits in the tumor; scale bars = 600 nm. (E) Percentage of mitochondria from FLC patient 9 with Ca2+ deposits; the mean is reported from manual counting of >500 mitochondria per sample by two independent, blinded analysts. (F) Immunoblots of uniporter components and control mitochondrial proteins from paired non-tumor (N) and FLC tumor (T) samples. (G) Pooled quantification of immunoblots in (F) normalized to TOM20 levels; statistical significance was determined by one-sample t-test. (H) H&E and MCU IHC staining of non-tumor (N) and tumor (T) regions of liver from FLC patient 9; 40x and 100x image scale bars are 500 μm and 200 μm, respectively. (I) qPCR analysis of MCU RNA expression in paired non-tumor liver (NTL) and tumors from FLC patients 29, 42.1, 47, and 59. (J) MCU transcript expression in indicated datasets in tumor (FLC) and normal liver (NML). All error bars indicate standard deviation; numbers above error bars indicate p-values; * indicates a p-value < 0.05.

