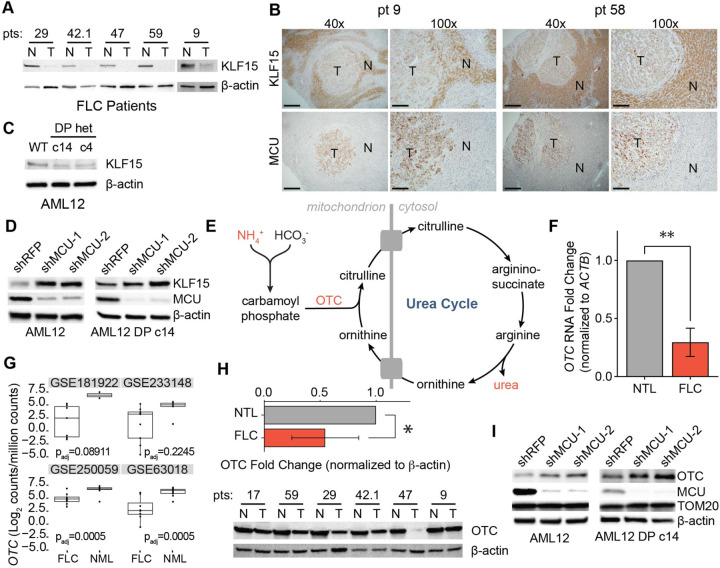
Figure 7: KLF15 and OTC expression are regulated by the uniporter in FLC.
(A) Immunoblots of KLF15 in paired non-tumor (N) and FLC tumor (T) lysates. (B) IHC of MCU or KLF15 on non-tumor (N) and tumor (T) regions from FLC patients 9 and 58; 40x and 100x image scale bars are 500 μm and 200 μm, respectively. (C) Immunoblot of KLF15 from WT AML12, c14, and c4 lysates. (D) Immunoblots of KLF15 from WT AML12 and c14 lysates following MCU knockdown. (E) Schematic of the urea cycle, metabolites, and OTC, a mitochondrial protein with reduced levels in FLC. (F) qPCR analysis of OTC mRNA expression in paired non-tumor liver and tumors from FLC patients 29, 42.1, 47, and 59; statistical significance was determined by one sample t-test; n=4 (G) OTC mRNA expression in normal liver (NML) and FLC tumors in the indicated gene expression datasets. (H) Immunoblot of OTC and quantification of OTC levels relative to β-actin from paired non-tumor (N) and FLC tumor (T) lysates; statistical significance was determined by one sample t-test; n=5. (I) Immunoblots of OTC from WT AML12 and c14 lysates following MCU knockdown. All error bars indicate standard deviation; * indicates a p-value < 0.05 and ** indicates a p-value < 0.01.

