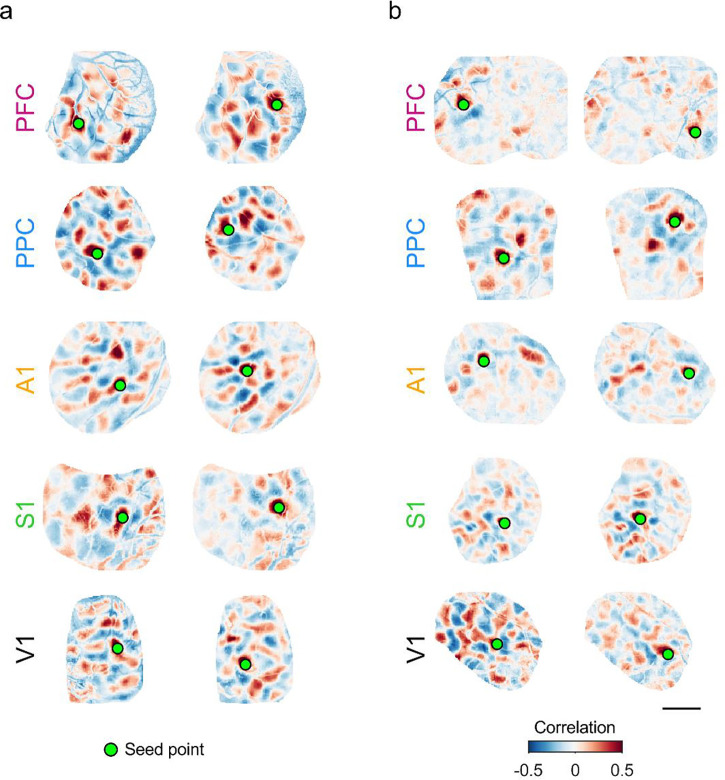
Figure 5: Millimeter-scale modular correlations across diverse brain areas after eye-opening.
a. Correlations across spontaneous events for representative experiments at P27–32. Pixelwise correlations are shown relative to two different seed points for each area. Note that the spatial patterns of correlations vary between seed points, reflecting multiple distinct correlated networks. b. Modular correlations are still present at P39–43 in all cortical areas examined. Scale bar: 1 mm.

