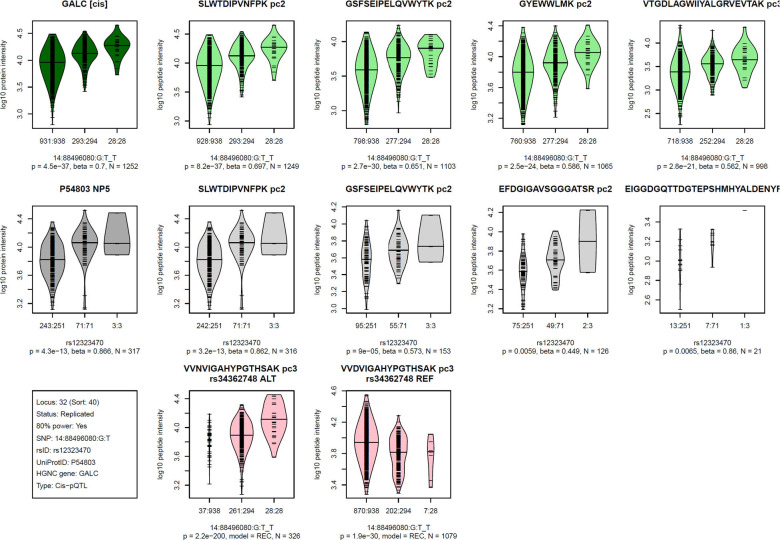
Figure 3: Visualization of the Proteograph MS-proteomics data for a prototypical pQTL.
Violin plots of log-scaled engine-normalized protein and peptide intensities by genotype for the indicated protein and genetic variant (bottom left box, details are in Table S2); Top row (green): Tarkin data, using PAV-exclusive library, Middle row (grey): QMDiab data, using PAV-exclusive library, Bottom row (red): Tarkin data, using PAV-inclusive library, limited to PAV containing peptides; Plot titles indicate the protein UniProt identifier and the pQTL type (cis/trans) above the Tarkin protein plot, and HGNC gene name and nanoparticle number are above the QMDiab protein plot; Titles of the peptide plots indicate the respective peptide sequences and precursor charges (pc), and additionally the PAV variant rsID and allele type (REF/ALT) for the PAV peptide plots; Summary statistics are reported below the plots based on linear models with residualized and inverse-normal scaled data for associations with the PAV-exclusive library data (top two rows) and Fisher’s exact test for PAV-inclusive library data (bottom row); Associations with peptide data are sorted by increasing p-values from left to right and limited to a maximum of four plots; Whenever peptides were detected at multiple precursor charge values, only the strongest association was plotted; Numbers at the x-axis tick marks indicate the number of detected peptides by genotype followed by the number a samples with the corresponding genotype (e.g. 662:665); Genotypes are ordered as (1) other allele, (2) heterozygote, (3) effect allele, where the effect allele is indicated following the SNP name (chr:pos:ref:alt_eff, e.g. 3:49721532:G:A_A). Similar plots for all 252 pQTLs are provided as Figure S2.

