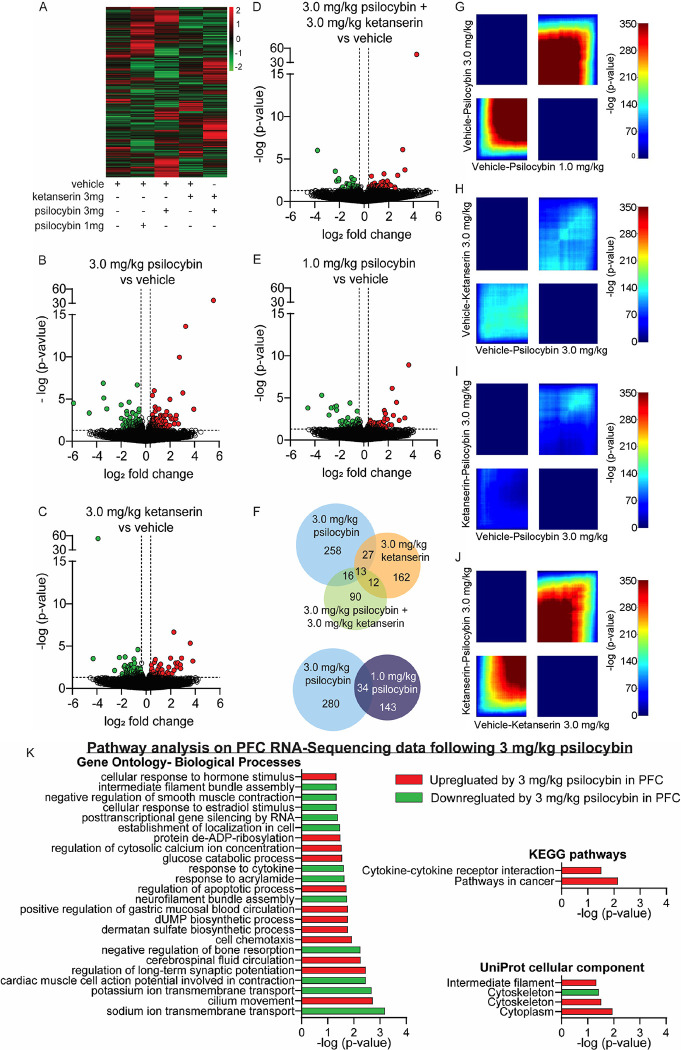
Figure 4: Psilocybin induces unique gene expression profiles in the PFC at varying doses that are blocked by ketanserin.
(A) Heatmap of PFC gene expression profiles obtained from tissue collected 24 hours after a single injection of psilocybin and/or ketanserin. (B-E) Volcano plots depicting differential gene expression in the PFC between vehicle treated animals and treatment with 3.0 mg/kg psilocybin (B), 3.0 mg/kg ketanserin (C), 3.0 mg/kg psilocybin and ketanserin (D), or 1.0 mg/kg psilocybin (E). (F) Venn diagram of total genes regulated by psilocybin and/or ketanserin in the PFC and the number of genes regulated by more than one treatment group. (G-H) RRHO plots were generated to compare all gene expression data between animals treated with 3.0 mg/kg psilocybin and 1.0 mg/kg psilocybin (G), 3.0 mg/kg ketanserin and 3.0 mg/kg psilocybin (H), 3.0 mg/kg ketanserin + 3.0 mg/kg psilocybin and psilocybin 3mg/kg alone (I), or 3.0 mg/kg ketanserin + 3.0 mg/kg psilocybin and ketanserin 3mg/kg alone (J). Lower left quadrant represents genes up-regulated in both groups while upper right quadrant represents genes down-regulated in both groups. (K) Gene ontology, KEGG pathway analysis and Uniprot cellular compartments of genes regulated in the PFC following a single exposure of 3.0 mg/kg psilocybin in drug-naïve animals. n=4/group.

