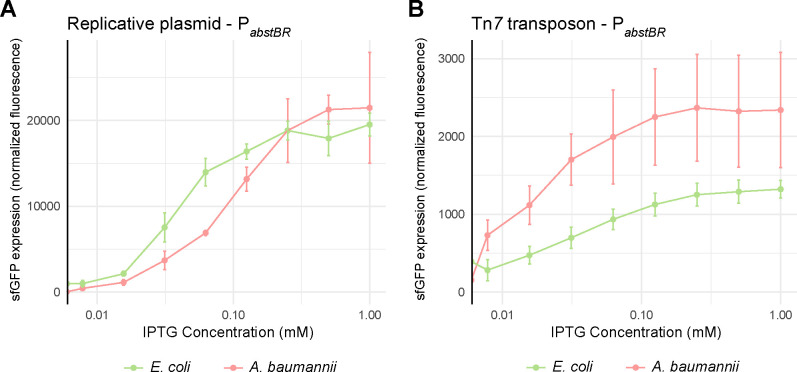
Figure 3. Titration of PabstBR expression at the population level.
Titration of expression from (A) the replicative plasmid or (B) the Tn7 transposon. Plots shown are normalized sfGFP levels expressed from PabstBR across IPTG concentrations for E. coli BW25113 and A. baumannii ATCC 17978. Error bars represent standard deviation (n=3 for replicative vector, n=6 for Tn7 transposon).

