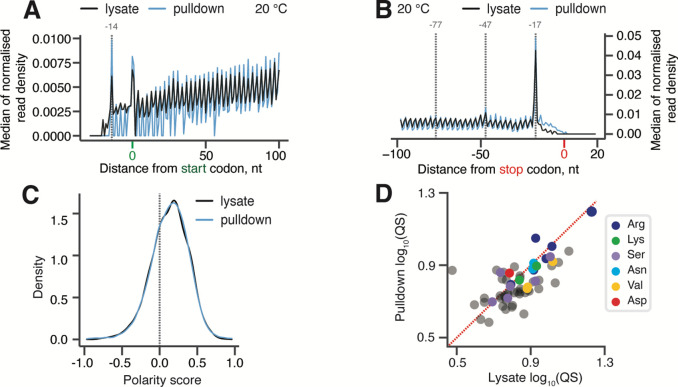
Figure 2. New1 samples the ribosome throughout the translation cycle.
(A,B) 5PSeq metagene analysis. The 5’ read ends for of pulldown (blue) and lysate (black) samples aligned to start (A) and stop codons (B). Stalls represent the 5’ boundary of the ribosome-protected 5’-phosphorylated mRNA fragment. The 5’ position is offset by −14 nt from the fist nucleotide in the P site and −17 nt from the first nucleotide in the ribosomal A site. (C) Distributions of ribosome polarity scores across transcriptome for immunoprecipitated New1-HTF ribosome complexes (pulldown, blue) and the input lysate (black). Positive and negative scores reflect enrichment of reads towards either 3’ and 5’ end of CDS, respectively. (D) Ribosomal queuing scores (QS) calculated for ORFs parsed by the codon preceding the stop codon. The red dashed line is a guide for the expected position of data points in the absence of the systematic difference between in QS between the pulldown and lysate samples. All analyses were performed on pooled lysate and New1 pulldown datasets from four biological replicates each.

