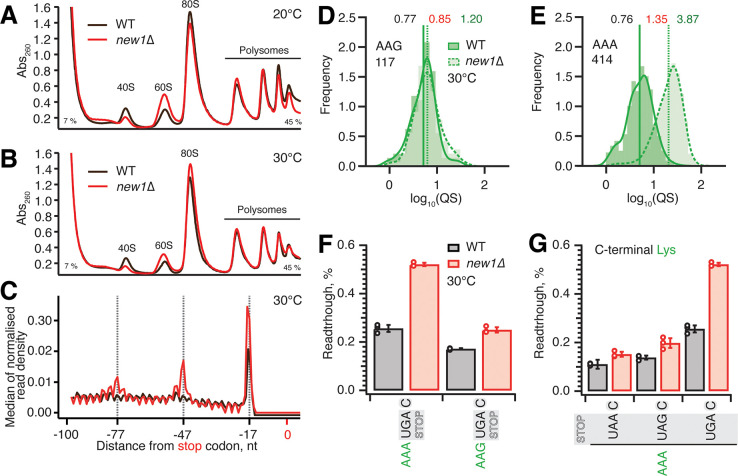
Figure 7. Ribosomal queuing and termination defects of new1Δ strain are uncoupled from the growth defect at low temperature.
(A,B) Polysome profile analysis of wild-type (MYJ1171) and new1Δ (MYJ1173) yeast cells grown exponentially at 20°C (F) or 30°C (G) in SC media. Polysomes were resolved on 7–45% sucrose gradients. All experiments performed at 30°C with the exception of (F), 5PSeq data analysis was performed on pooled data sets from three biological replicates. (C) Metagene analysis of the 5’ read ends for the 5PSeq libraries generated from wild-type (WT MYJ1171, black trace) and New1-deficient (new1Δ MYJ1173, red trace) yeast strains grown at 30°C. (D,E) QS distributions sorted by AAG lysine (D) or AAA lysine C-terminal codons (E), geomean QS values in the wild-type and new1Δ strains are given in black and red respectively and fold change in QS in green. (F) Readthrough of C-terminal AAA and AAG lysine codons in combination with a UGA stop codon. Error bars represent standard deviations. (G) Readthrough values of UAA, UAG and UGA stop codons in combination with a C-terminal AAA lysine codon. Error bars represent standard deviations. To make the data comparison easier, the same AAA UGA C results are shown in panel (F) and (G).

