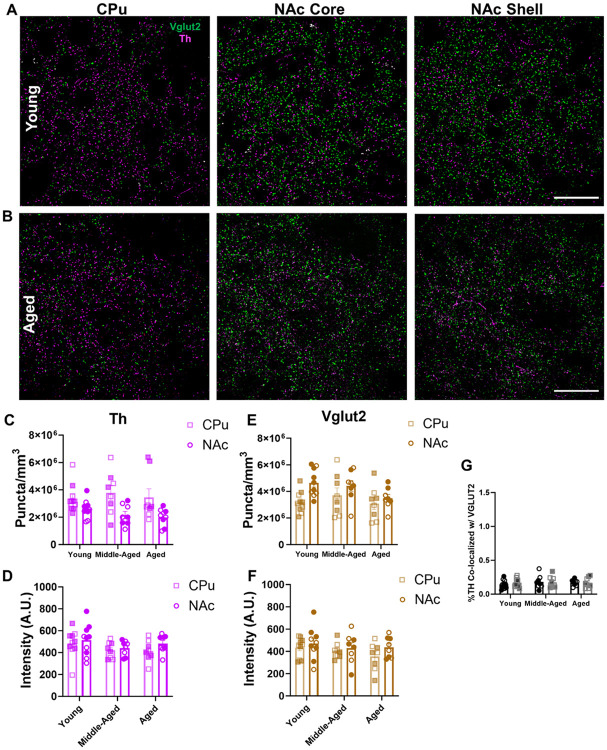
Figure 3. Th and Vglut2 protein expression is unaltered across aging in mouse striatum.
(A-B) 60× representative images of immunohistochemical labeling of Th (in magenta) and Vglut2 (in green) protein in the CPu, NAc core, and NAc shell subregions of mouse striatum; scale bars=25μm. (C) There was no change in Th+ puncta density across aging. There were significantly higher levels of Th+ puncta in the CPu compared to the NAc (F2,46=0.3, P=0.74 for effect of age; F1,46=16.3, P=0.0002 for effect of region; F2,46=0.8, P=0.46 for effect of interaction). (D) There was no change in Th+ puncta intensity across aging or between striatal regions (F2,46=2.1, P=0.13 for effect of age, F1,46=1.7, P=0.20 for effect of brain region; F2,46=0.23, P=0.79 for effect of interaction). (E) There was no change in Vglut2+ puncta density across age. There were significantly higher levels of Vglut2+ puncta in the NAc compared to CPu (F2,46=2.2, P=0.12 for effect of age; F1,46=7.6, P=0.0083 for effect of region; F2,46=1.1, P=0.35 for effect of interaction). (F) There was no change in Vglut2+ puncta intensity across age or striatal region (F2,46=1.1, P=0.33 for effect of age; F1,46=2.2, P=0.14 for effect of region; F2,46=0.3, P=0.74 for effect of interaction). (G) There were low levels of TH co-localization with Vglut2 (~0.2%) that remained unchanged with age or across NAc sub-region (F2,46=0.3, P=0.71 for effect of age; F1,46=0.1, P=0.79 for effect of NAc sub-region; F2,46=0.2, P=0.84 for effect of interaction). Shaded symbols represent female animals and open symbols represent males. Bars represent mean±SEM with points representing individual animals; N=8-10 per group.

