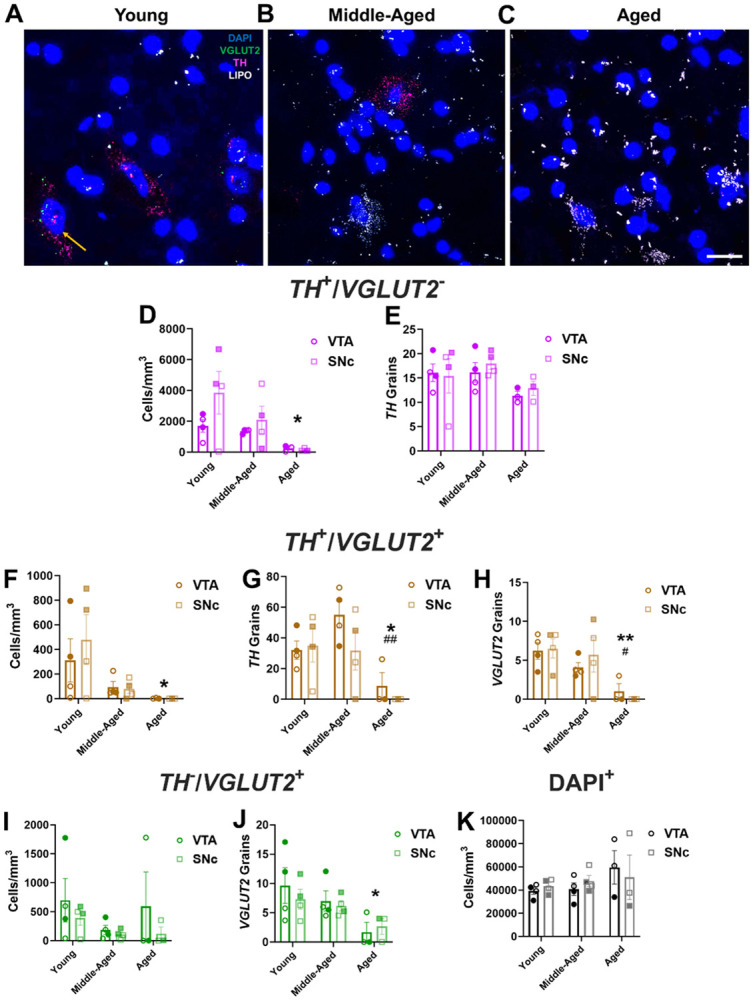
Figure 4. Age-related decreases in TH and VGLUT2 mRNA expression in human VTA and SNc.

(A-C) Representative 60× multiplex RNAscope images showing mRNA expression of TH (in magenta) and VGLUT2 (in green) mRNA expression alongside DAPI-labeled nuclei (in blue) in postmortem midbrains of young, middle-aged, and aged subjects; lipofuscin (LIPO, in white) was also present in middle-aged and aged tissue; scale bar=25μm. (D) There was an age-related decrease in cell density of non-glutamatergic TH+ neurons (TH+/VGLUT2−) (F2,16=5.2, P=0.018 for effect of age, F1,15=2.1, P=0.16 for effect of brain region; F2,15=1.1, P=0.37 for effect of interaction). (E) TH mRNA grain numbers in TH+ neurons did not change between age groups or across region (F2,15=2.5, P=0.12 for effect of age; F1,15=0.2, P=0.63 for effect of brain region; F2,15=0.2, P=0.83 for effect of interaction). (F) TH+/VGLUT2+ cell density diminished with age (F2,16=5.6, P=0.014 for effect of age; F1,16=0.2, P=0.63 for effect of region; F2,16=0.4, P=0.7 for effect of interaction). (G) TH mRNA grains per cell declined across aging (F2,16=8.6, P=0.0029 for effect of age; F1,16=1.6, P=0.23 for effect of region; F2,16=1.1, P=0.36 for effect of interaction). (H) VGLUT2 mRNA grains per cell decreased across aging (F2,16=9.7, P=0.0018 for effect of age; F1,16=0.1, P=0.78 for effect of brain region; F2,16=0.5, P=0.63 for effect of interaction). (I) Among non-dopaminergic VGLUT2+ midbrain neurons (TH−/VGLUT2+), there was no significant change in cell density (F2,16=1.2, P=0.32 for effect of age; F1,16=1.7, P=0.21 for effect of region; F2,16=0.27, P=0.77 for effect of interaction). (J) Numbers of VGLUT2 mRNA grains per cell were significantly decreased in aged subjects compared to young subjects (F2,16=5.1, P=0.019 for effect of age; F1,16=0.2121, P=0.65 for effect of region; F2,16=0.34, P=0.72 for effect of interaction). (K) There was no change in the density of DAPI-stained nuclei with age (F2,16=1.3, P=0.29 for effect of age; F1,16=0.02, P=0.90 for effect of region; F2,16=0.4, P=0.66 for effect of interaction). Shaded symbols represent female subjects and open symbols represent male subjects. Bars represent mean±SEM with points representing individual subjects; N=3-4 per group. *P<0.05 compared to young subjects. #P<0.05 compared to middle-aged subjects.
