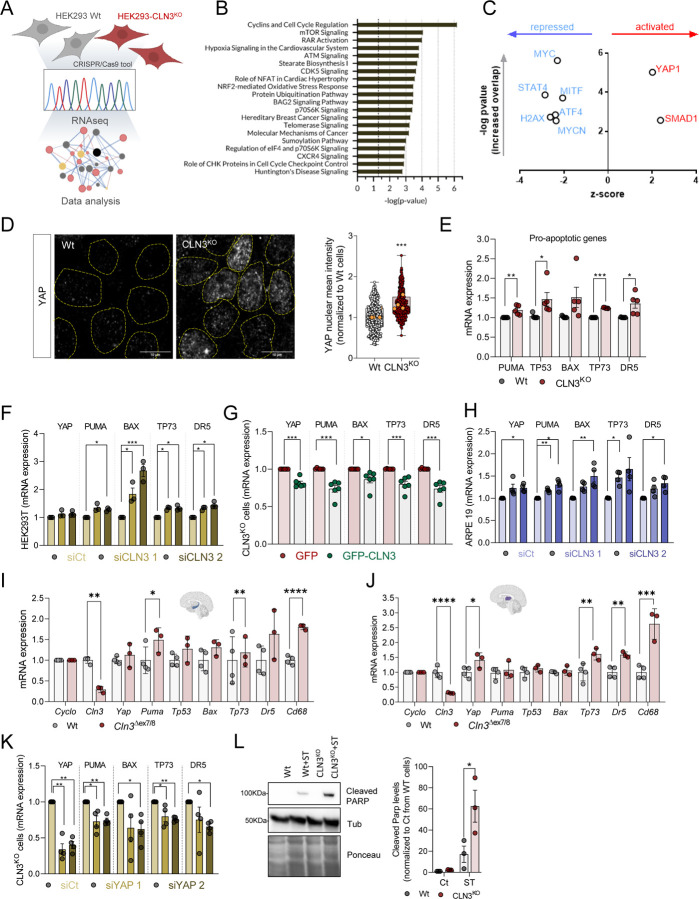
Figure 1. YAP signalling pathway is activated in CLN3KO cells and drives a pro-apoptotic phenotype.
(A) Schematic representation of the experimental design. (B) Pathway enrichment analysis of the differentially expressed genes (DEG). (C) Transcription factors predicted from the DEG list (B) represented on a volcano plot of z-score (y-axis) versus p-value of target enrichment on the DEG (x-axis) (D) Confocal fluorescence images of Wt and CLN3KO cells immunostained for YAP protein. Nuclei are outlined by the yellow dashed lines using Hoechst staining. Scale bar 10µm. On the right, quantification of the mean intensity of YAP at the nucleus of at least 100 cells per each conditions. The yellow dots represent the mean of each independent experiment. (E-H) mRNA levels of YAP target genes involved in apoptosis in HEK293T WT and CLN3KO stable cell lines (E), in WT cells with transient CLN3-depletion using two different siRNA (F), CLN3KO cell line transfected with GFP or GFP-CLN3 and Wt cell line using two different siRNA (G). (H) mRNA levels of YAP target genes involved in apoptosis in ARPE19 cell line transfected with control (siCt) or two different siRNA directed to CLN3 transcript. (I-J) mRNA levels of YAP-target pro-apoptotic genes in hippocampus (I) and thalamus (J) tissue collected from 12 months old control (Wt) and Cln3Δex7/8 animals. (K) mRNA levels of YAP target genes involved in apoptosis in HEK293T CLN3KO cell line transfected with control (siCt) or two different siRNA directed to YAP transcript. (L) Representative immunoblot of cleaved PARP and quantification of HEK293T (Wt and CLN3KO) cells with or without staurosporine (ST) treatment (4 hours). All the results are mean±SEM of at least three independent experiments. Statistical analysis with one-way ANOVA followed by Sidak’s multiple comparisons test (E), Tukey’s post-test (F, H, K), and Student’s t-tests when comparing two experimental groups. * p<0.05; ** p<0.01; ***p<0.001.

