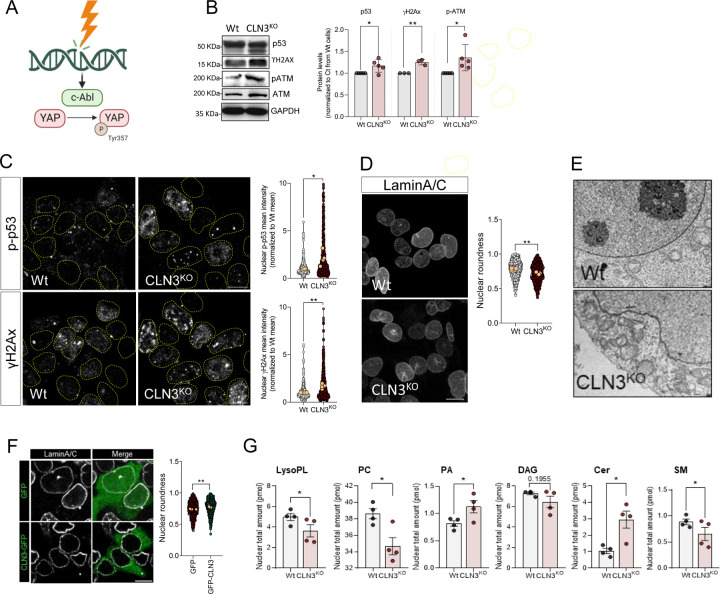
Figure 4. Accumulation of DNA damage in CLN3-KO cells drives c-Abl and nuclear dysmorphism.
(A) Schematic representation of c-Abl activation in response to DNA damage. C-Abl directly phosphorylate YAP at the position Y357 in response to DNA damage. (B) Representative immunoblot image and quantification of p53, γH2AX, p-ATM and ATM protein levels in Wt and CLN3KO cells. GAPDH was used as loading controls. (C) Confocal fluorescence images of HEK293T Wt and CLN3KO cells immunostained for p-p53 and γH2AX proteins. Nucleus are outlined by the yellow dashed line using Hoechst staining. Scale bar 10µm. Graphs are the quantification of the mean intensity of p-p53 (upper panel) and γH2AX (bottom panel) at the nucleus from at least 100 cells per condition in each independent experiment, with a total of at least 450 cells. (D) Confocal fluorescence images of HEK293T Wt and CLN3KO cells immunostained for LaminA/C proteins. Scale bar 10µm. Graphs represent the quantification of nuclear morphology parameters in HEK293T Wt and CLN3KO cells immunostained for LaminA/C: circularity (up, right), aspect ratio (up, left), roundness (down, left) and solidity (down, right). (E) Transmission electron microscopy of HEK293T Wt and CLN3KO cells. (F) Confocal fluorescence images of HEK293T CLN3KO cells transfected with GFP or GFP-CLN3 and immunostained for LaminA/C proteins. Scale bar 10µm. Graphs represent the quantification of nuclear morphology parameters in HEK293T Wt and CLN3KO cells immunostained for LaminA/C: circularity, aspect ratio, roundness and solidity. (F) Lipid composition of nuclear extracts isolated from HEK293T Wt or CLN3KO cells. LysoPL= lysophospholipids, PC phosphatidylcholine, PA = phosphatidic acid, DAG= diacylglycerol, Cer= ceramide, SM=sphingomyelin. In the violin plots, yellow dots represent the mean of each individual experiment. All the results are mean±SEM of at least three independent experiments. * p<0.05; ** p<0.01; ***p<0.001. * p<0.05; *** p<0.001; using unpaired t-test.

