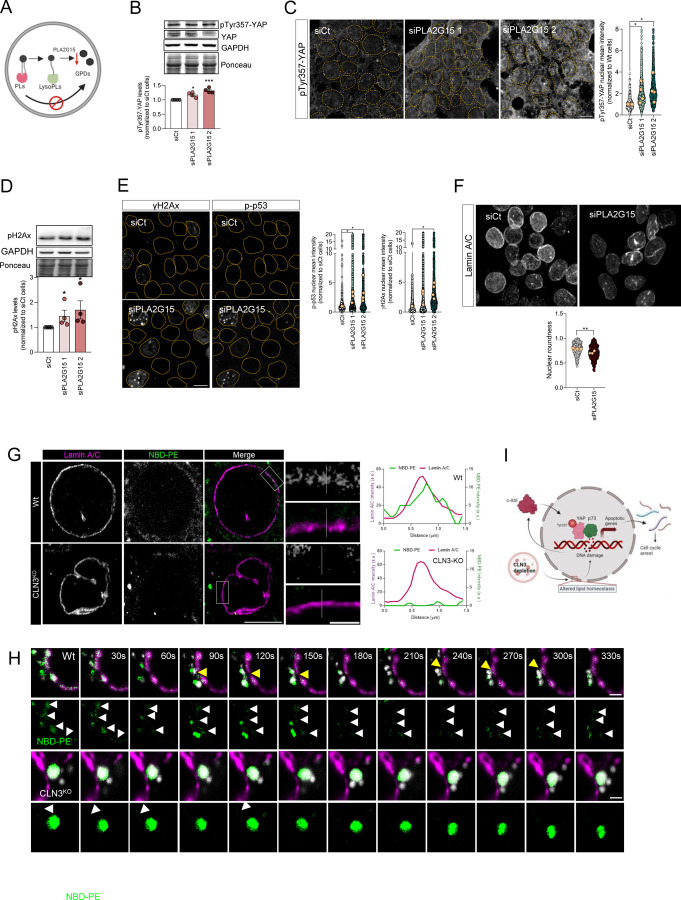
Figure 5. Inhibition of glycerophosphodiesters generation at the lysosome has the same effect on DNA damage and nuclear morphology as loss of CLN3.
(A) Schematic representation of glycerophosphodiesters (GPDs) synthesis inhibition by affecting the activity of lysosomal lipases that mediate the hydrolysis of phospholipids into GDPs. (B) Representative immunoblot image and quantification of pTyr357-YAP protein levels in Wt cells silenced for YAP, using two different siRNA against lysosomal lipase A2 (PLA2G15). Ponceau was used as loading control. (C) Confocal fluorescence images and quantification of HEK293T Wt and cells depleted from PLA2G15 using two siRNA immunostained for pTyr357-YAP. Nucleus are outlined by the yellow dashed line using Hoechst staining. Scale bar 10µm. (D) Representative immunoblot image (above) and quantification (below) of γH2AX protein levels in Wt and CLN3KO cells. Ponceau was used as loading controls. (E) Confocal fluorescence images and quantification (left for p-p53, right for γH2AX) of HEK293T parental cells transfected with siCT or siRNA against PLA2G15 using two different siRNA. Nucleus are outlined by the yellow dashed line using Hoechst staining. Scale bar 10µm. (F) Confocal fluorescence images of HEK293T Wt and CLN3KO cells immunostained for Lamin-B proteins. Scale bar 10µm. The graphs represent the quantification of nuclear morphology parameters in HEK293T Wt and CLN3KO cells immunostained for Lamin-A/C: circularity, aspect ratio, roundness and solidity. In the violin plots, yellow dots represent the mean of each individual experiment. (G) Representative confocal images of control and CLN3-depleted cells loaded for 24h with liposomes. To track the lipids distribution, cells were incubated with liposomes contain 1,2-myristoyl-sn-glycero-3-phosphoethanolamine-N-(7-nitro-2-1,3-benzoxadiazol-4-yl) (NBD-PE). At the upper panels, cells were stained for Lamin A/C. The graphs represent the fluorescence intensity profile of NBD-PE and Lamin A/C along the white line crossing the selected nuclear region (white line) in the inset. Scale bar 10µm and 2µm in the insets. (H) Schematic representation of our working model. (I) Timelapse images of live HEK293T Wt and CLN3KO cells transfected with Lamin A-mRFP. For lysosomal labelling, cells were loaded with dextran AlexaFluor 647. Yellow arrows point near proximity of lysosomes and Lamin A, and white arrows highlight NBD-PE at nuclear envelope. Scale bar 2µm. All the results are mean±SEM of at least three independent experiments. * p<0.05; ** p<0.01; ***p<0.001. * p<0.05; *** p<0.001; using unpaired t-test.

