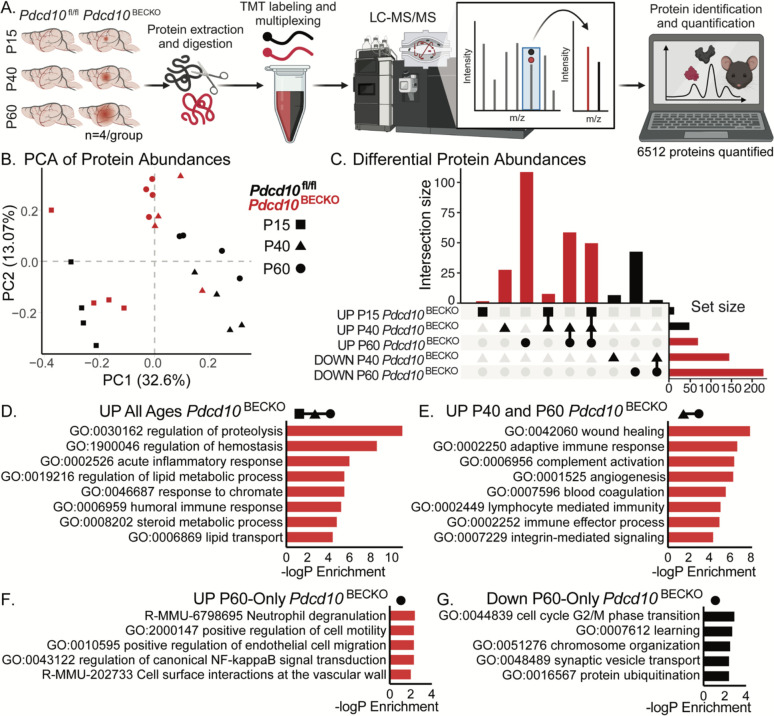
Figure 3. Whole-brain proteome profile of Pdcd10BECKO at different stages of CCM lesion genesis.
A) Schematic diagram of Pdcd10fl/fl and Pdcd10BECKO murine brain tissue preparation for quantitative multiplexed proteomics, comparing P15, P40, and P60 aged mice (n=4/group). B) Principal component analysis of all quantified proteins. C) UpSet plot of significantly differentially abundant proteins identified in binary comparisons of Pdcd10BECKO versus age-matched Pdcd10fl/fl controls by group. Significantly differentially abundant proteins were assessed by a combination of Welch’s t-tests with a p-value of < 0.05 and a π-score of > 1. D-G) Gene ontology analyses of proteins D) up in abundance at all ages in Pdcd10BECKO: Pdcd10fl/fl, E) up at ages P40 and P60 in Pdcd10BECKO: Pdcd10fl/fl, F) up uniquely at age P60 in Pdcd10BECKO: Pdcd10fl/fl, and G) down uniquely at age P60 in Pdcd10BECKO: Pdcd10fl/fl.

