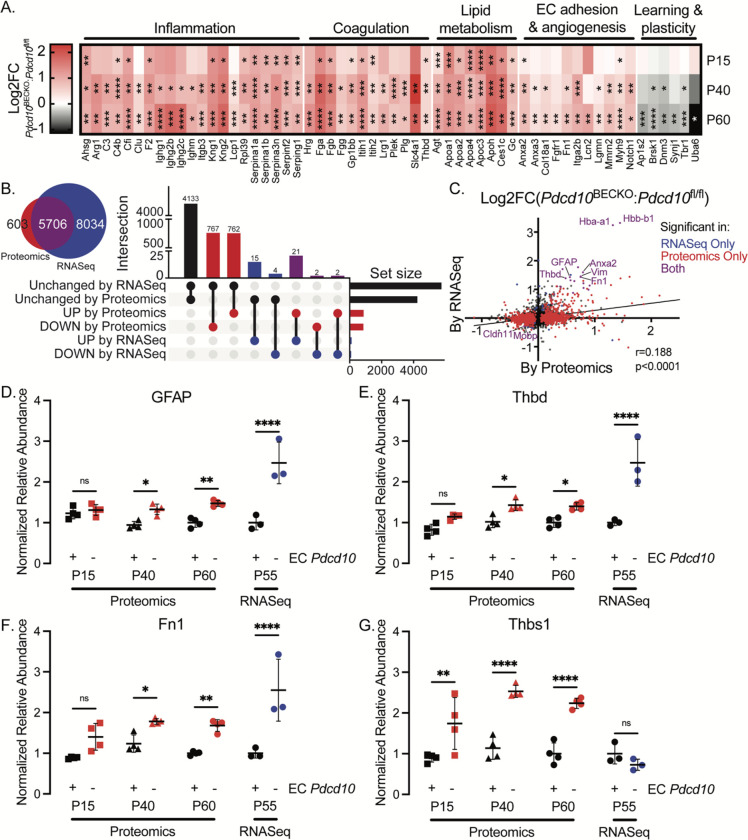
Figure 4. Pdcd10BECKO whole-brain proteome profiling indicates elevated neuroinflammation and thrombosis, especially by P60.
A) Heatmap of differentially abundant proteins quantified in Pdcd10BECKO murine brain tissue, colored by the fold-change of Pdcd10BECKO: Pdcd10fl/fl, organized by ontology. Statistical significance is represented with *, **, ***, and **** indicating p-values of less than 0.05, 0.01, 0.001, and 0.0001, respectively. B) Venn diagram illustrating overlapping detected genes between current proteomics and previous transcriptomics study48, and UpSet plot illustrating overlapping and uniquely significant genes in binary comparisons across the study, looking at P60 and P55 mice in the proteomics and transcriptomics studies, respectively. C) Linear correlation between fold-changes of Pdcd10BECKO: Pdcd10fl/fl in present proteomics and previous transcriptomics studies, with significantly different genes in color. D-G) Previously reported markers of CCM are recapitulated by the current proteomics study and show an increase with age. Each graph is normalized to the average P60 of Pdcd10fl/fl, and error bars represent the standard deviation.

