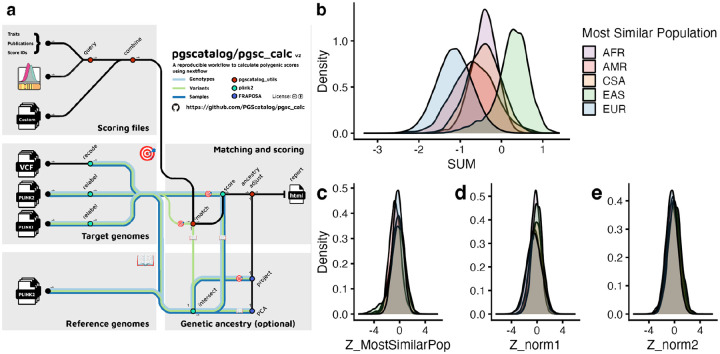
Figure 2. The PGS Catalog Calculator for reproducible PGS calculation with estimation and adjustment for genetic ancestry.
(a) Visual summary of the PGS Catalog Calculator (pgsc_calc) pipeline, displaying the inputs, outputs, and data flows between modules. (b-e) To illustrate the utility of the pipeline we calculated PGS000018 (metaGRSCAD, 1,745,179 variants)31 applied in all ~487,000 individuals with imputed genotypes in UK Biobank32 using pgsc_calc and ran the ancestry adjustments using HGDP+1kGP as a reference panel. (b) The PGS calculated as a weighted SUM of dosages has different distributions in different ancestry groups (grouped based on their Most Similar Population label from the reference panel: African [AFR], American [AMR], Central and South Asian [CSA], East Asian [EAS], and European [EUR] superpopulation ancestry). (c-e) Ancestry adjustment methods applied to UK Biobank data make PGS distributions more comparable across populations. The most similar ancestry group labels are used to normalize PGS using their most similar reference population distribution (Z_MostSimilarPop, c). Population labels are not used in continuous ancestry adjustment methods that adjust for mean (Z_norm1, d) and variance (Z_norm2, e) but are grouped in order to visualize the overlap after normalization.

