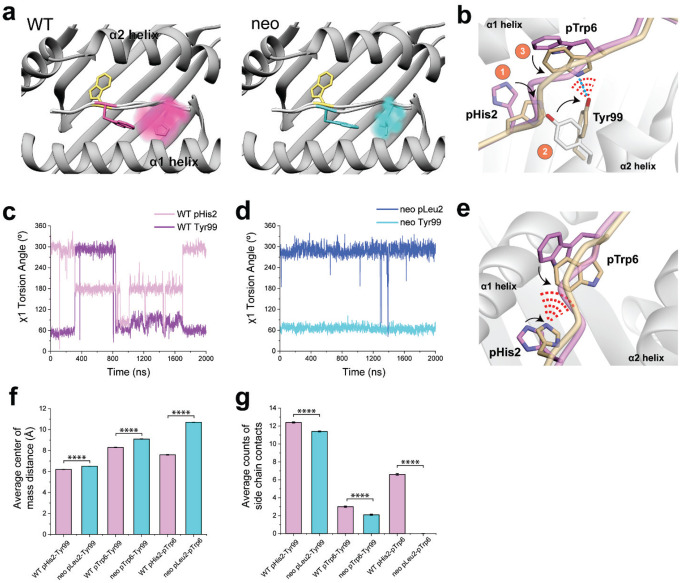
Figure 5. The extensive motions of p2His in the WT peptide/HLA-A3 complex lead to more direct and indirect interactions with p6Trp as it moves in the binding groove.
A) Volume occupied by pHis2 during the simulations with the WT peptide (left) or pLeu2 during the simulations with the neoantigen (right). Color density reflects degree of sampling (voxels sampled <10% of the time excluded). Note the greater mobility of pHis2 in the WT peptide. The TCR4-bound conformation of pTrp6 is colored yellow. B) In the simulation with the WT peptide, the movement of pHis2 induces an alternate conformation for Tyr99 of HLA-A3 and subsequent formation of contacts (red dashes) and a hydrogen bond (blue line) between the Tyr99 altered conformer and pTrp6 in the WT peptide. Structural snapshot is representative of cluster 1 in Fig. S2B. C) The χ1 torsion angles of Tyr99 of HLA-A3 and pHis2 of the peptide during the WT peptide/HLA-A3 simulation. During the first half of the simulation, the rotation in pHis2 induces a rotation in Tyr99 (in the latter half of the simulation, the peptide N-terminus has become less recessed in the binding groove, decoupling pHis2/Tyr99 motion). D) The χ1 torsion angles of pLeu2 and Tyr99 remain fixed in the simulation with the neoantigen. E) Other conformations of pHis2 in the simulation with the WT peptide show contacts (red dashes) between the side chains of the histidine and pTrp6. Structural snapshot is representative of cluster 2 in Extended Data Fig. 2. F) Average centers of mass between the side chains of the position 2 amino acid, pTrp6, and Tyr99 during the simulations with the neoantigen and WT peptide. Average distances are all closer in the WT simulation. Error bars are SEM, calculated from the 2000 1 ns frames of the 2 μs simulations. **** = p<0.0001. G) Average counts of side chain contacts between the side chains of the position 2 amino acid, pTrp6, and Tyr99 during the simulations with the neoantigen and WT peptide. Contacts are all higher in the WT simulation. Error bars are SEM, calculated from the 2000 1ns frames of the 2 μs simulations. **** = p<0.0001.

