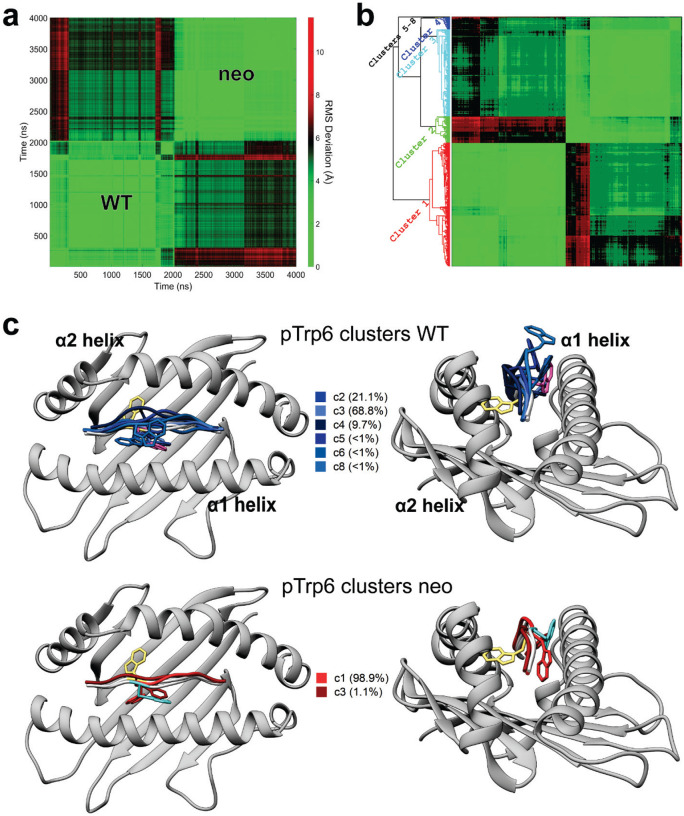
Extended Data Figure 1. Conformational clustering reveals different conformational states sampled by pTrp6 in the PIK3CA neoantigen and WT peptide/HLA-A3 complexes.
A) 2D RMSD analysis of the pTrp6 amino acid over the course of the neoantigen and WT peptide/HLA-A3 simulations after superimposition of the HLA-A3 binding groove. Quadrants for the WT and neoantigen simulations are indicated; the much higher values in the cross-simulation quadrants illustrate the different conformational sampling. B) Cluster analysis of the 2D RMSD data from panel A (supplemented with TCR-free and TCR4-bound coordinates as indicated in the Methods). pTrp6 clustered into 8 major conformations as indicated. Cluster 2 reflected the TCR-free and Cluster 7 (not sampled during the simulations) reflected the TCR4-bound conformations. C) Visualization of the pTrp6 conformational clusters for the WT peptide (top) and neoantigen (bottom), showing the tendency for pTrp6 to move above the backbone in the WT simulation, but below the backbone in the neoantigen simulation. The crystallographic coordinates of the WT, TCR-free neoantigen, and TCR4-bound neoantigen are colored magenta, cyan, and yellow.

