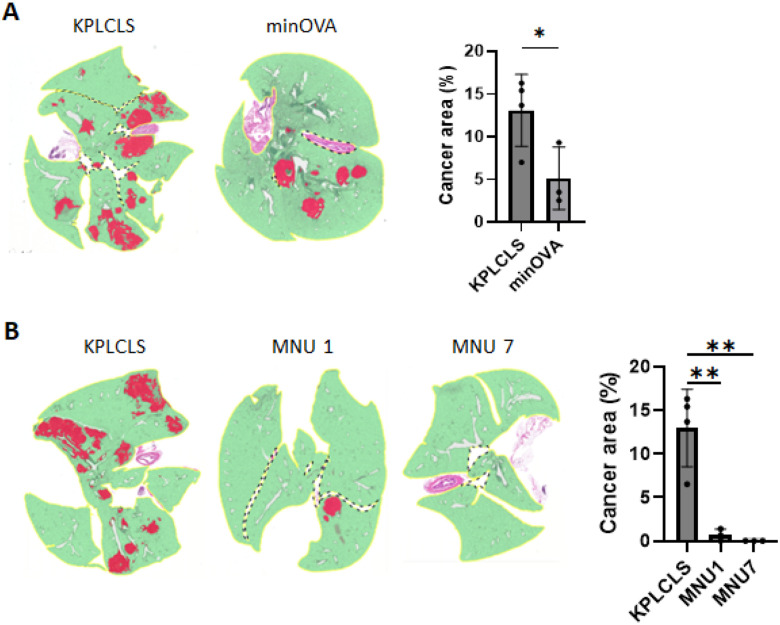
Figure 3. Tumor immunogenicity suppresses tumor growth.
(A) KPLCLS or KPLCLS-minOVA cells, and (B) KPLCLS or MNU treated KPLCLS cells (1.0 × 10⁶) were intratracheally injected into WT mice, and the lung tissues were collected after 36 days. Formalin-fixed tissues were stained with H&E and the tumor areas were quantified using AI-powered HALO software. (n=4 for KPLCLS, n=3 for KPLCLS-minOVA). *P<0.05, **P<0.01, Tukey’s one-way ANOVA.

