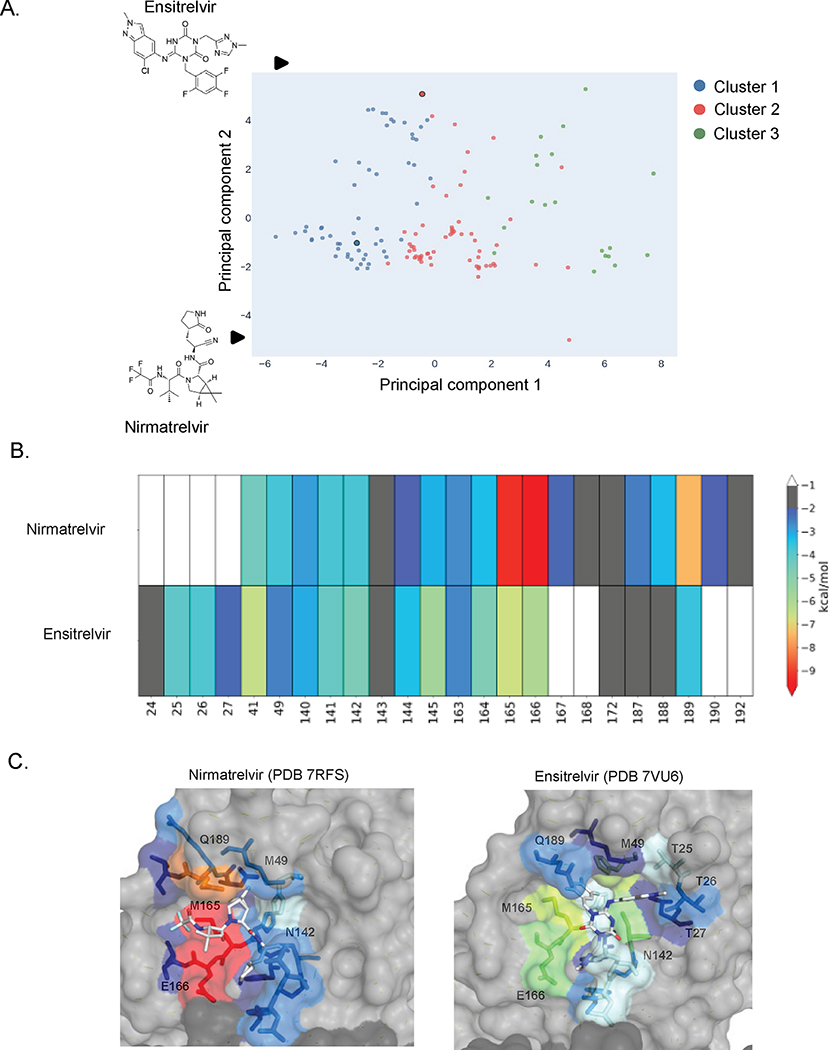
Figure 2. Principal component analysis of vdW interactions show distinct modes of nirmatrelvir and ensitrelvir binding.
A) Primary component analysis of potent compounds (IC50 < 1 uM) based on strength of van der Waals interactions. PCA data was grouped on three clusters. Nirmatrelvir and ensitrelvir are in clusters 1 and 2 respectfully. B) Heat map based on strength of van der Waals interactions between inhibitor and Mpro residues. C) Strength of van der Waals interactions between Mpro residues and nirmatrelvir (PDB 7RFS) 3 or ensitrelvir (PDB 7vu6) 18 mapped to structure.

