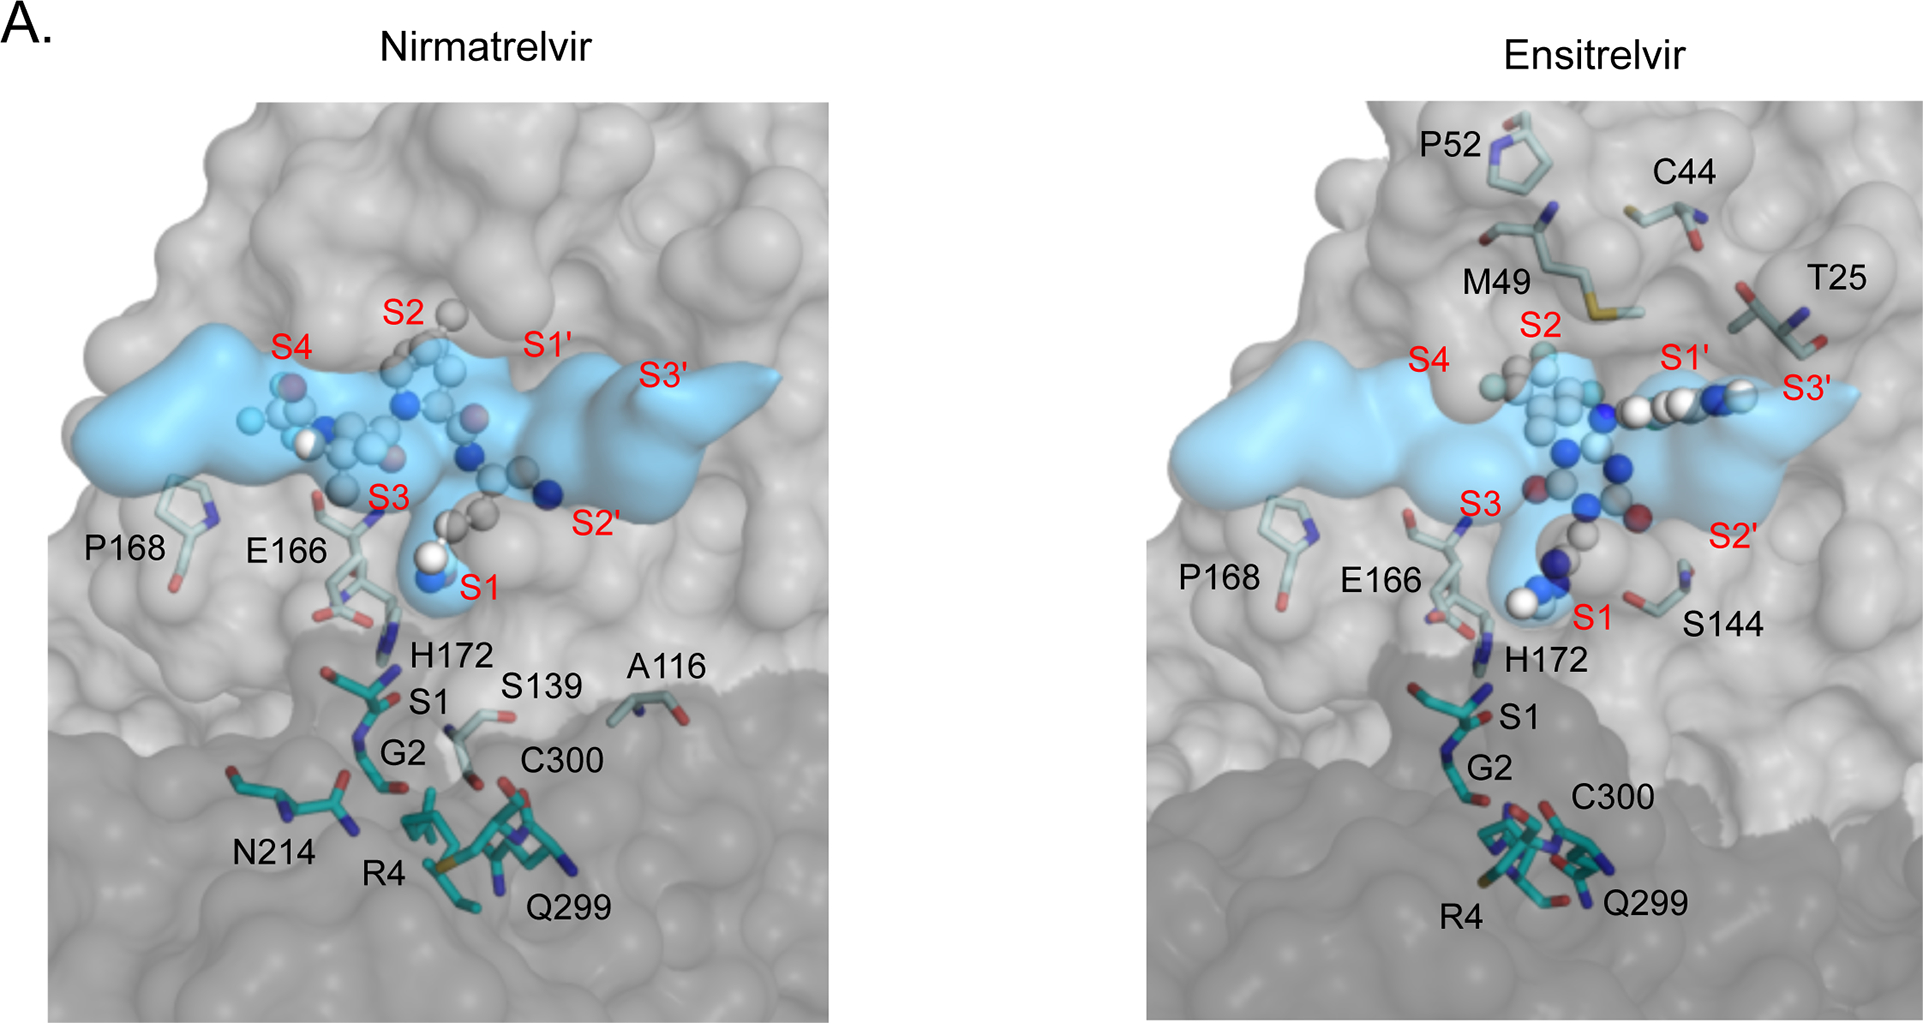
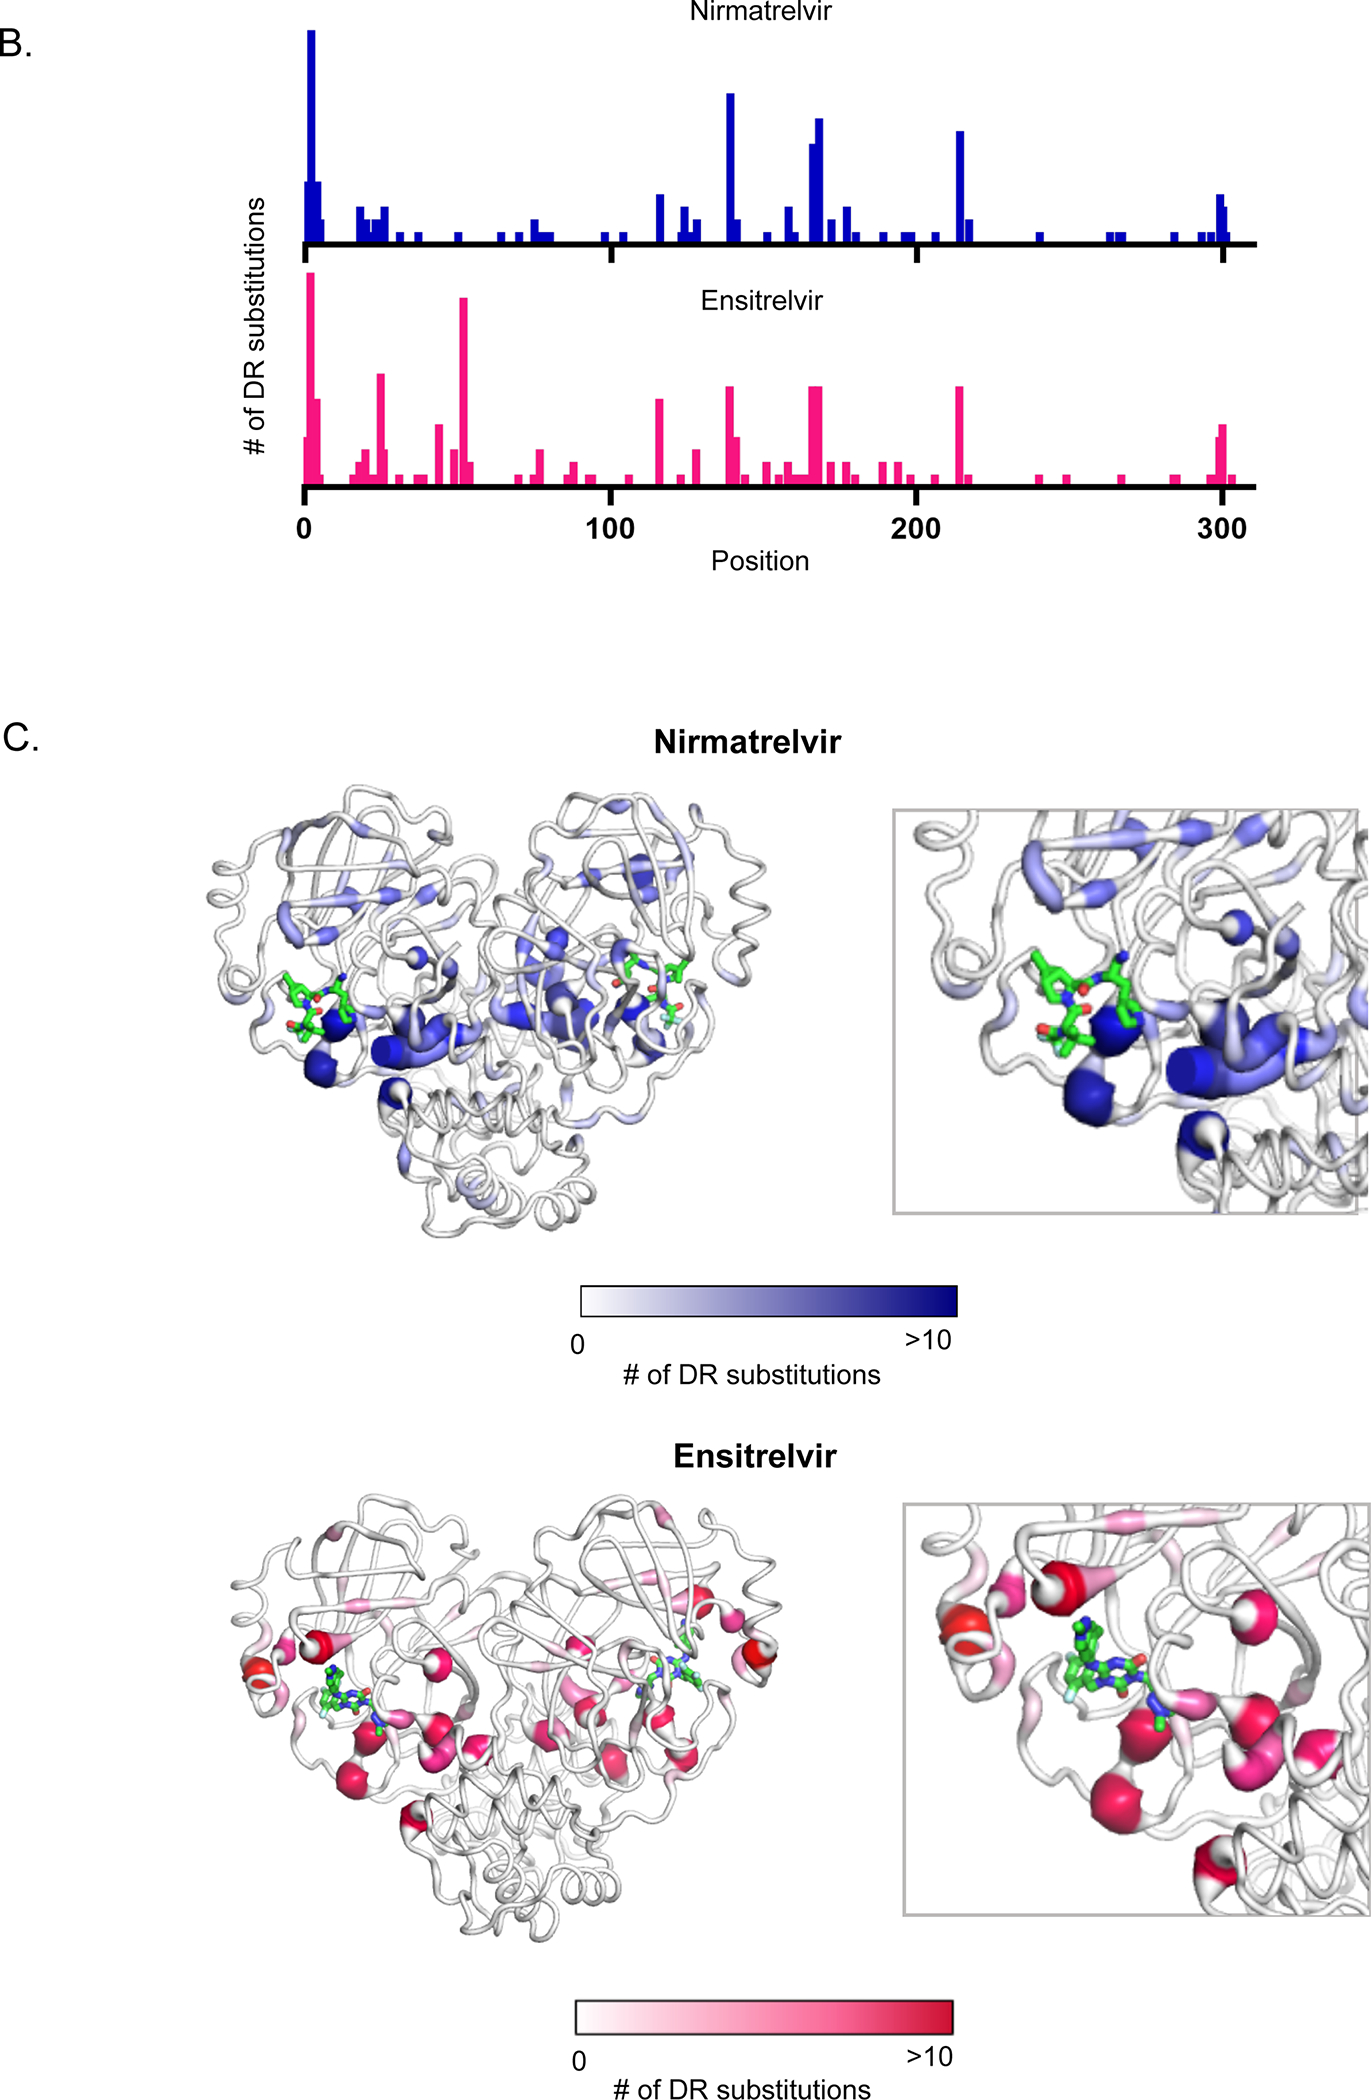
Figure 6. Structural distribution of apparent drug resistance mutations.


A) The fit of nirmatrelvir (left panel) and ensitrelvir (right panel) within the substrate envelope. The labeled Mpro positions are those that contain the 30 mutations with the highest DR scores. S1, G2, R4, N214, Q299 and C300 are located on monomer B (shown in darker gray) and are represented as cyan sticks. The S4-S3’ binding subsites are labeled in red. B) The number of nirmatrelvir and ensitrelvir resistance mutations at each position of Mpro. C) The number of nirmatrelvir and ensitrelvir resistance mutations at each position of Mpro are mapped to the Mpro-inhibitor structures. Inhibitors are shown in green.
